Zubin Dowlaty
Created Date: 2018-11-15
Modified Date: 2025-10-16
1. Abstract
The HVT package offers a suite of R functions designed to constructtopologypreserving maps for in-depth analysis of multivariate data. It isparticularly well-suited for datasets with numerous records. The packageorganizes the typical workflow into several key stages:
Data Compression: Long datasets are compressedusing Hierarchical Vector Quantization (HVQ) to achieve the desiredlevel of data reduction.
Data Projection: Compressed cells are projectedinto one and two dimensions using dimensionality reduction algorithms,producingembeddingsthat preserve the original topology. This allows for intuitivevisualization of complex data structures.
Tessellation: Voronoi tessellation partitionsthe projected space into distinct cells, supporting hierarchicalvisualizations. Heatmaps and interactive plots facilitate explorationand insights into the underlying data patterns.
Scoring: Test dataset is evaluated againstpreviously generated maps, enabling their placement within the existingstructure. Sequential application across multiple maps is supported ifrequired.
Temporal Analysis and Visualization: Functionsin this stage examine time-series data to identify patterns, estimatetransition probabilities, and visualize data flow over time.
Dynamic Forecasting: Monte Carlo simulations ofMarkov chain provides forecasting capabilities for both ex-post andex-ante scenarios with meticulously handling problematic states whenfound.
The HVT package allows creation of visually stunning tessellations,showcasing the power of topology preserving maps. Below is an imagedepicting a captivating tessellation of a torus, seevignettefor more details.
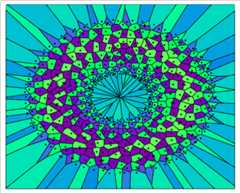
Figure 1: The Voronoi tessellation for layer 1 and number of cells500 with the heat map overlaid for variable ‘z’.
2.Vignettes
Following are the links to the vignettes for the HVT package:
| Version | Vignette Title | Description |
|---|---|---|
| v18.05.17 | HVTVignette | Contains the workflow of the functions used for vector quantizationand construction of Hierarchical Voronoi Tessellations for dataanalysis. |
| v18.05.17 | HVTModel Diagnostics Vignette | Contains demonstrations of functions used to perform modeldiagnostics and validation for the trained HVT model. |
| v23.05.16 | HVTScoring Cells with Layers using scoreLayeredHVT | Contains explanations of the functions used for scoring cells withlayers based on a sequence of maps using scoreLayeredHVT. |
| v23.10.26 | TemporalAnalysis and Visualization: Leveraging Time Series Capabilities inHVT | Contains implementations of the functions used for analyzing timeseries data and creating its state transition flow maps. |
| v24.05.16 | VisualizingLLM Embeddings using HVT | Contains implementation and analysis of hierarchical clusteringusing functions to evaluate and visualize token embeddings generated byOpenAI in 2D Space. |
| v24.08.14 | Implementationof t-SNE and UMAP in trainHVT function | Contains enhancements to thetrainHVT function withadvanced dimensionality reduction techniques such as t-SNE and UMAP, andincludes a table of evaluation metrics to improve interpretability. |
| v25.03.01 | DynamicForecasting of Macroeconomic Time Series Dataset using HVT | Contains enhancements to the HVT package for dynamic forecastingusing Monte Carlo Simulations of Markov Chain (MSM) on macroeconomictime series dataset. |
| v25.08.25 | HyperparameterExperimentation for Champion Model Selection in MSM DynamicForecasting | Contains enhancements to enable strategic selection of the championmodel based on the lowest Mean Absolute Error by hyperparameter tuningin msm - dynamic forecasting. |
3.Version History
3.7 HVT (v25.2.7) - What’s New
16th October, 2025
In this version of the HVT package, the following new feature andvignette have been introduced:
Feature
Experimentation of hyperparameters in
msm: This update introduces a new function calledHVTMSMoptimizationthat runs grid search experiments acrossdifferent hyperparameters (number of cells, clusters(k), nearestneighbors(nn)) by training and scoring HVT models, running MSMsimulations for each combination and identify the champion model (lowestMAE across all results).Tabulation and Visualization: Accessoryfunctions to
HVTMSMoptimizationsuch asOptimizationResultsandplotMsmKNhas beenadded which helps to tabulate all the iterations and visualize theoutput via plotly object.
Vignette
- Hyperparameter Experimentation for Champion Model Selectionin MSM Dynamic Forecasting: This vignette provides acomprehensive demonstration of using
HVTMSMoptimization,covering the complete workflow from initial dataset handling, selectionfor train & test, executing hyperparameter tuning and identifyingthe champion model, implementing the champion model, and comparing MAEresults.
The issue with time-series animation plots from previous releasehas now been resolved with the latest gganimate update.
3.6 HVT (v25.2.5)
04th July, 2025
Dropping the time-series animation plots from the package sincethe latest version of gganimate doesn’t support them — a patched releasewill follow once the issue is resolved.
3.5 HVT (v25.2.4)
04th June, 2025
In this version of the HVT package, the following new features andvignette have been introduced:
Features
Dynamic Forecasting of a Time Series Dataset:This update introduces a new function called
msmMonteCarlo Simulations of Markov Chain for dynamic forecasting of states intime series dataset. It supports both ex-post and ex-ante forecasting,offering valuable insights into future trends while resolving statetransition challenges through clustering and nearest-neighbor methods toenhance simulation accuracy.Z score Plots: This update introduces a newfunction called
plotZscorethat generates Z-score plotscorresponding to the HVT cells for the given data, offering a visualrepresentation of data distribution and highlighting potentialoutliers.
Vignette
- Dynamic Forecasting of Macroeconomic Time Series Datasetusing HVT: This vignette illustrates the practical use of thenew msm function on a macroeconomic dataset with 10 variables. It coversall steps, including data preparation, model training, scoring, andforecasting, while addressing challenges related to state transitionsand evaluating performance using Mean Absolute Error (MAE).
3.4 HVT (v24.9.1)
4th September, 2024
In this version of the HVT package, the following new features andvignettes have been introduced:
Features
Implementation of t-SNE and UMAP in
trainHVT: This update incorporates dimensionalityreduction methods like t-SNE and UMAP in thetrainHVTfunction, complementing the existing Sammon’s projection. It alsoenables the visualization of these techniques across all hierarchicallevels within the HVT framework.Implementation of dimensionality reduction evaluationmetrics: This update introduces highly effective dimensionalityreduction evaluation metrics as part of the output list of the
trainHVTfunction. These metrics are organized into twolevels: Level 1 (L1) and Level 2 (L2). The L1 metrics address key areasof dimensionality reduction which are mentioned below, by ensuringcomprehensive evaluation and performance.
- Structure Preservation Metrics
- Distance Preservation Metrics
- Human Centered Metrics
- Interpretive Quality Metrics
- Computational Efficiency Metrics
- Introduction of
clustHVTfunction: Inthis update, we introduced a new function calledclustHVTspecifically designed for Hierarchical clustering analysis. The functionperforms clustering of cells exclusively when the hierarchy level is setto 1, determining the optimal number of clusters by evaluating variousindices. Based on user input, it conducts hierarchical clustering usingAGNES with the default ward.D2 method. The output includes a dendrogramand an interactive 2D clustered HVT map that reveals cell context uponhovering. This function is not applicable when the hierarchy level isgreater than 1.
Vignettes
Implementation of t-SNE and UMAP in
trainHVTfunction: This vignette showcases the integration of t-SNE andUMAP in thetrainHVTfunction, offering a comprehensiveguide on how to apply and visualize these dimensionality reductiontechniques. It also covers the dimensionality reduction evaluationmetrics and provides insights into their interpretation.Visualizing LLM Embeddings using HVT (HierarchicalVoronoi Tessellation): This vignette will outline the processof analyzing OpenAI-generated token embeddings using the HVT package,covering data compression, visualization, and hierarchical clustering,as well as comparing domain name assignments for clusters. It examinesHVT’s effectiveness in preserving contextual relationships betweenembeddings. Additionally, it provides a brief overview of the newlyadded
clustHVTfunction and its parameters.
3.3 HVT (v24.5.2)
2nd May, 2024
In this version of HVT package, the following new features have beenintroduced:
- Updated Nomenclature: To make the function namesmore consistent and understandable/intuitive, we have renamed thefunctions throughout the package. Given below are the fewinstances.
HVTtotrainHVTpredictHVTtoscoreHVTpredictLayerHVTtoscoreLayeredHVT
- Restructured Functions: The functions have beenrearranged and grouped into new sections which are highlighted on theindex page of package’s PDF documentation. Given below are the fewinstances.
trainHVTfunction now resides within theTraining_or_Compressionsection.plotHVTfunction now resides within theTessellation_and_Heatmapsection.scoreHVTfunction now resides within theScoringsection.
Enhancements: The pre-existed functions,
hvtHmapandexploded_hmap, have been combinedand incorporated into theplotHVTfunction. Additionally,plotHVTnow includes the ability to perform 1Dplotting.Temporal Analysis
- The new update focuses on the integration of time seriescapabilities into the HVT package by extending its foundationaloperations to time series data which is emphasized in thisvignette.
- The new functionalities are introduced to analyze underlyingpatterns and trends within the data, providing insights into itsevolution over time and also offering the capability to analyze themovement of the data by calculating its transitioning probability andcreates elegant plots and GIFs.
Below are the new functions and its brief descriptions:
plotStateTransition: Provides the time series flowmapplot.getTransitionProbability: Provides a list of transitionprobabilities.reconcileTransitionProbability: Provides plots andtables for comparing transition probabilities calculated manually andfrom markovchain function.plotAnimatedFlowmap: Creates flowmaps and animationsfor both self state and without self state scenarios.
3.2 HVT (v23.11.02)
17th November, 2023
This version of HVT package offers functionality to score cells withlayers based on a sequence of maps created usingscoreLayeredHVT. Given below are the steps to created thesuccessive set of maps.
Map A - The output of
trainHVTfunction which is trained on parent data.Map B - The output of
trainHVTfunction which is trained on the ‘data with novelty’ created fromremoveNoveltyfunction.Map C - The output of
trainHVTfunction which is trained on the ‘data without novelty’ created fromremoveNoveltyfunction.
ThescoreLayeredHVT function uses these three maps toscore the test datapoints.
Let us try to understand the steps with the help of the diagrambelow
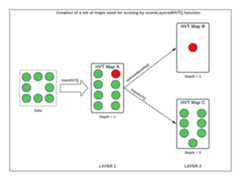
Figure 2: Data Segregation for scoring based on a sequence of mapsusing scoreLayeredHVT()
3.1 HVT (v22.12.06)
06th December, 2022
This version of HVT package offers features for both training an HVTmodel and eliminating outlier cells from the trained model.
Training or Compression: The initial stepentails training the parent data using the
trainHVTfunction, specifying the desired compression percentage and quantizationerror.Remove novelty cells: Following the trainingprocess, outlier cells can be identified manually from the 2D hvt plot.These outlier cells can then be inputted into the
removeNoveltyfunction, which subsequently produces twodatasets in its output: one containing ‘data with novelty’ and the othercontaining ‘data without novelty’.
4. Installation of HVT(v25.2.7)
CRAN Installation
install.packages("HVT")
Git Hub Installation
library(devtools)devtools::install_github(repo = "Mu-Sigma/HVT")
[8]ページ先頭