| Version: | 2.7.4 |
| Date: | 2025-12-08 |
| Title: | High-Throughput Toxicokinetics |
| Description: | Pre-made models that can be rapidly tailored to various chemicals and species using chemical-specific in vitro data and physiological information. These tools allow incorporation of chemical toxicokinetics ("TK") and in vitro-in vivo extrapolation ("IVIVE") into bioinformatics, as described by Pearce et al. (2017) (<doi:10.18637/jss.v079.i04>). Chemical-specific in vitro data characterizing toxicokinetics have been obtained from relatively high-throughput experiments. The chemical-independent ("generic") physiologically-based ("PBTK") and empirical (for example, one compartment) "TK" models included here can be parameterized with in vitro data or in silico predictions which are provided for thousands of chemicals, multiple exposure routes, and various species. High throughput toxicokinetics ("HTTK") is the combination of in vitro data and generic models. We establish the expected accuracy of HTTK for chemicals without in vivo data through statistical evaluation of HTTK predictions for chemicals where in vivo data do exist. The models are systems of ordinary differential equations that are developed in MCSim and solved using compiled (C-based) code for speed. A Monte Carlo sampler is included for simulating human biological variability (Ring et al., 2017 <doi:10.1016/j.envint.2017.06.004>) and propagating parameter uncertainty (Wambaugh et al., 2019 <doi:10.1093/toxsci/kfz205>). Empirically calibrated methods are included for predicting tissue:plasma partition coefficients and volume of distribution (Pearce et al., 2017 <doi:10.1007/s10928-017-9548-7>). These functions and data provide a set of tools for using IVIVE to convert concentrations from high-throughput screening experiments (for example, Tox21, ToxCast) to real-world exposures via reverse dosimetry (also known as "RTK") (Wetmore et al., 2015 <doi:10.1093/toxsci/kfv171>). |
| Depends: | R (≥ 2.10) |
| Imports: | deSolve, msm, data.table, survey, mvtnorm, truncnorm, stats,graphics, utils, magrittr, purrr, methods, Rdpack (≥ 2.3),ggplot2, dplyr |
| RdMacros: | Rdpack |
| Suggests: | knitr, rmarkdown, gplots, scales, EnvStats, MASS,RColorBrewer, stringr, reshape, viridis, gmodels, colorspace,cowplot, ggrepel, forcats, smatr, gridExtra, readxl, ks,testthat, ggpubr, tidyverse |
| License: | MIT + file LICENSE |
| LazyData: | true |
| LazyDataCompression: | xz |
| Encoding: | UTF-8 |
| VignetteBuilder: | knitr |
| RoxygenNote: | 7.3.3 |
| BugReports: | https://github.com/USEPA/CompTox-ExpoCast-httk/issues |
| NeedsCompilation: | yes |
| Packaged: | 2025-12-08 16:30:38 UTC; WambaughJohn |
| Author: | John Wambaugh [aut, cre], Sarah Davidson-Fritz [aut], Robert Pearce [aut], Caroline Ring [aut], Greg Honda [aut], Mark Sfeir [aut], Matt Linakis [aut], Dustin Kapraun [aut], Kimberly Truong [aut], Colin Thomson [aut], Meredith Scherer [aut], Annabel Meade [aut], Celia Schacht [aut], Leonie Lautz [aut], Todor Antonijevic [ctb], Miyuki Breen [ctb], Shannon Bell [ctb], Xiaoqing Chang [ctb], Jimena Davis [ctb], Elaina Kenyon [ctb], Gilberto Padilla Mercado [ctb], Katie Paul Friedman [ctb], Nathan Pollesch [ctb], Noelle Sinski [ctb], Nisha Sipes [ctb], James Sluka [ctb], Caroline Stevens [ctb], Barbara Wetmore [ctb], Lily Whipple [ctb], Woodrow Setzer [ctb] [aut, cre], Sarah Davidson-Fritz [aut], Robert Pearce [aut], Caroline Ring [aut], Greg Honda [aut], Mark Sfeir [aut], Matt Linakis [aut], Dustin Kapraun [aut], Kimberly Truong [aut], Colin Thomson [aut], Meredith Scherer [aut], Annabel Meade [aut], Celia Schacht [aut], Leonie Lautz [aut], Todor Antonijevic [ctb], Miyuki Breen [ctb], Shannon Bell [ctb], Xiaoqing Chang [ctb], Jimena Davis [ctb], Elaina Kenyon [ctb], Gilberto Padilla Mercado [ctb], Katie Paul Friedman [ctb], Nathan Pollesch [ctb], Noelle Sinski [ctb], Nisha Sipes [ctb], James Sluka [ctb], Caroline Stevens [ctb], Barbara Wetmore [ctb], Lily Whipple [ctb], Woodrow Setzer [ctb] |
| Maintainer: | John Wambaugh <wambaugh.research@gmail.com> |
| Repository: | CRAN |
| Date/Publication: | 2025-12-09 06:10:32 UTC |
httk: High-Throughput Toxicokinetics
Description
Pre-made models that can be rapidly tailored to various chemicals and species using chemical-specific in vitro data and physiological information. These tools allow incorporation of chemical toxicokinetics ("TK") and in vitro-in vivo extrapolation ("IVIVE") into bioinformatics, as described by Pearce et al. (2017) (doi:10.18637/jss.v079.i04). Chemical-specific in vitro data characterizing toxicokinetics have been obtained from relatively high-throughput experiments. The chemical-independent ("generic") physiologically-based ("PBTK") and empirical (for example, one compartment) "TK" models included here can be parameterized with in vitro data or in silico predictions which are provided for thousands of chemicals, multiple exposure routes, and various species. High throughput toxicokinetics ("HTTK") is the combination of in vitro data and generic models. We establish the expected accuracy of HTTK for chemicals without in vivo data through statistical evaluation of HTTK predictions for chemicals where in vivo data do exist. The models are systems of ordinary differential equations that are developed in MCSim and solved using compiled (C-based) code for speed. A Monte Carlo sampler is included for simulating human biological variability (Ring et al., 2017doi:10.1016/j.envint.2017.06.004) and propagating parameter uncertainty (Wambaugh et al., 2019doi:10.1093/toxsci/kfz205). Empirically calibrated methods are included for predicting tissue:plasma partition coefficients and volume of distribution (Pearce et al., 2017doi:10.1007/s10928-017-9548-7). These functions and data provide a set of tools for using IVIVE to convert concentrations from high-throughput screening experiments (for example, Tox21, ToxCast) to real-world exposures via reverse dosimetry (also known as "RTK") (Wetmore et al., 2015doi:10.1093/toxsci/kfv171).
Author(s)
Maintainer: John Wambaughwambaugh.research@gmail.com (ORCID)
Authors:
Sarah Davidson-Fritzdavidsonfritz.sarah@epa.gov (ORCID)
Robert Pearce (ORCID)
Caroline RingRing.Caroline@epa.gov (ORCID)
Greg Hondahonda.gregory@epa.gov (ORCID)
Mark Sfeir
Matt LinakisMLINAKIS@ramboll.com (ORCID)
Dustin Kapraunkapraun.dustin@epa.gov (ORCID)
Kimberly Truongtruong.kimberly@epa.gov (ORCID)
Colin Thomsonthomson.colin@epa.gov (ORCID)
Meredith SchererScherer.Meredith@epa.gov (ORCID)
Annabel Meadeaemeade7@gmail.com (ORCID)
Celia SchachtSchacht.Celia@epa.gov (ORCID)
Leonie Lautzleonie.lautz@wur.nl (ORCID)
Other contributors:
Todor Antonijevictantonijevic@toxstrategies.com (ORCID) [contributor]
Miyuki Breenbreen.miyuki@epa.gov (ORCID) [contributor]
Shannon BellShannon.bell@inotivco.com (ORCID) [contributor]
Xiaoqing ChangXiaoqing.chang@inotivco.com (ORCID) [contributor]
Jimena Davis [contributor]
Elaina Kenyonkenyon.elaina@epa.gov (ORCID) [contributor]
Gilberto Padilla MercadoPadillaMercado.Gilberto@epa.gov (ORCID) [contributor]
Katie Paul FriedmanPaul-Friedman.Katie@epa.gov (ORCID) [contributor]
Nathan Polleschpollesch.nathan@epa.gov (ORCID) [contributor]
Noelle SinskiNoelle.Sinski@icf.com [contributor]
Nisha Sipessipes.nisha@epa.gov (ORCID) [contributor]
James Slukajsluka@indiana.edu (ORCID) [contributor]
Caroline Stevensstevens.caroline@epa.gov (ORCID) [contributor]
Barbara Wetmorewetmore.barbara@epa.gov (ORCID) [contributor]
Lily Whipple [contributor]
Woodrow Setzer (ORCID) [contributor]
See Also
Useful links:
Report bugs athttps://github.com/USEPA/CompTox-ExpoCast-httk/issues
Test the check digit of a CAS number to confirm validity
Description
Chemical abstracts services registry numbers (CAS-RN) include a final digitas a "checksum" to test for validity (that is, that the number has not beencorrupted).
Usage
CAS.checksum(CAS.string)Arguments
CAS.string | A character string of three numbers separated by two dashes |
Details
The check digit (final number) is calculated by working from right to left,starting with the second to last digit of the CAS-RN. We multiply each digitby an increasing digit (1, 2, 3...) and sum as we work from right to left.The check digit should equal the final digit of the sum.
Value
logical (TRUE if final digit of CAS is consistent with other digits)
Author(s)
John Wambaugh
Reference for EPA Physico-Chemical Data
Description
The physico-chemical data in the chem.phys_and_invitro.data table areobtained from EPA's Comptox Chemicals dashboard. This variable indicatesthe date the Dashboard was accessed.
Usage
EPA.refFormat
An object of classcharacter of length 1.
Author(s)
John Wambaugh
Source
https://comptox.epa.gov/dashboard
A timestamp of table creation
Description
The Tables.RData file is separately created as part of building a newrelease of HTTK. This time stamp indicates the script used to build the fileand when it was run.
Usage
Tables.Rdata.stampFormat
An object of classcharacter of length 1.
Author(s)
John Wambaugh
Add a table of chemical information for use in making httk predictions.
Description
This function adds chemical-specific information to the tablechem.physical_and_invitro.data. This table is queried by the modelparameterization functions when attempting to parameterize a model, soadding sufficient data to this table allows additional chemicals to bemodeled.
Usage
add_chemtable( new.table, data.list, current.table = NULL, reference = NULL, species = NULL, overwrite = FALSE, sig.fig = 4, clint.pvalue.overwrite = TRUE, allow.na = FALSE, suppress.messages = FALSE)Arguments
new.table | Object of class data.frame containing one row per chemical,with each chemical minimally described by a CAS number. |
data.list | This list identifies which properties are to be read fromthe table. Each item in the list should point to a column in the tablenew.table. Valid names in the list are: 'Compound', 'CAS', 'DSSTox.GSID''SMILES.desalt', 'Reference', 'Species', 'MW', 'logP', 'pKa_Donor','pKa_Accept', 'logMA', 'Clint', 'Clint.pValue', 'Funbound.plasma','Fabs', 'Fgut', 'Rblood2plasma'. |
current.table | This is the table to which data are being added. |
reference | This is the reference for the data in the new table. Thismay be omitted if a column in data.list gives the reference value for eachchemical. |
species | This is the species for the data in the new table. This maybe omitted if a column in data.list gives the species value for eachchemical or if the data are not species-specific (e.g., MW). |
overwrite | If overwrite=TRUE then data in current.table will bereplaced by any data in new.table that is for the same chemical andproperty. If overwrite=FALSE (DEFAULT) then new data for the same chemicaland property are ignored. Funbound.plasma values of 0 (below limit ofdetection) are overwritten either way. |
sig.fig | Sets the number of significant figures stored (defaults to 4) |
clint.pvalue.overwrite | If TRUE then the Cl_int p-value is set to NA when the Cl_int value is changed unless a new p-value is provided. (defaultsto TRUE) |
allow.na | If TRUE (default is FALSE) then NA values are written to thetable, otherwise they are ignored. |
suppress.messages | Whether or not the output messages are suppressed. |
Value
data.frame | A new data.frame containing the data incurrent.table augmented by new.table |
Author(s)
John Wambaugh
Examples
library(httk)# Number of chemicals distributed with the package:num.chems <- length(get_cheminfo())fake <- data.frame(Compound="Tester", CASRN="222-11-1", DTXSID="DTX111222", MW=200, logP=3.5, Fup=0.1, Clint=0.1, Clint.pValue=0.001,stringsAsFactors=FALSE)chem.physical_and_invitro.data <- add_chemtable( fake, current.table=chem.physical_and_invitro.data, data.list=list( Compound="Compound", CAS="CASRN", DTXSID="DTXSID", MW="MW", logP="logP", Funbound.plasma="Fup", Clint="Clint", Clint.pValue="Clint.pValue"), species="Human", reference="Fake")calc_css(chem.name="Tester")#load_sipes2017()# We should have the ADMet Predicted chemicals from Sipes et al. (2017),# this one is a good test since the logP is nearly 10!#calc_css(chem.cas="26040-51-7")#Let's see how many chemicals we have now with the Sipes (2017) data loaded)=:#length(get_cheminfo())#Now let's resetreset_httk()# We should be back to our original number:num.chems == length(get_cheminfo())# Now add chemicals A, B, and C:my.new.data <- as.data.frame(c("A","B","C"),stringsAsFactors=FALSE)my.new.data <- cbind(my.new.data,as.data.frame(c( "111-11-2","222-22-0","333-33-5"), stringsAsFactors=FALSE))my.new.data <- cbind(my.new.data,as.data.frame(c("DTX1","DTX2","DTX3"), stringsAsFactors=FALSE))my.new.data <- cbind(my.new.data,as.data.frame(c(200,200,200)))my.new.data <- cbind(my.new.data,as.data.frame(c(2,3,4)))my.new.data <- cbind(my.new.data,as.data.frame(c(0.01,0.02,0.3)))my.new.data <- cbind(my.new.data,as.data.frame(c(0,10,100)))colnames(my.new.data) <- c("Name","CASRN","DTXSID","MW","LogP","Fup","CLint")chem.physical_and_invitro.data <- add_chemtable(my.new.data, current.table= chem.physical_and_invitro.data, data.list=list( Compound="Name", CAS="CASRN", DTXSID="DTXSID", MW="MW", logP="LogP", Funbound.plasma="Fup", Clint="CLint"), species="Human", reference="MyPaper 2015")parameterize_steadystate(chem.name="C") calc_css(chem.name="B") # Initialize a column describing proton donors ("acids")my.new.data$pka.a <- NA # set chemical C to an acid (pKa_donor = 5):my.new.data[my.new.data$Name=="C","pka.a"] <- "5"chem.physical_and_invitro.data <- add_chemtable(my.new.data, current.table= chem.physical_and_invitro.data, data.list=list( Compound="Name", CAS="CASRN", DTXSID="DTXSID", pKa_Donor="pka.a"), species="Human", reference="MyPaper 2015") # Note Rblood2plasma and hepatic bioavailability change (relative to above):parameterize_steadystate(chem.name="C") # Initialize a column describing proton acceptors ("bases")my.new.data$pka.b <- NA # set chemical B to a base with multiple pka's (pKa_accept = 7 and 8):my.new.data[my.new.data$Name=="B","pka.b"] <- "7;8"chem.physical_and_invitro.data <- add_chemtable(my.new.data, current.table= chem.physical_and_invitro.data, data.list=list( Compound="Name", CAS="CASRN", DTXSID="DTXSID", pKa_Accept="pka.b"), species="Human", reference="MyPaper 2015") # Note that average and max change (relative to above):calc_css(chem.name="B")Draws ages from a smoothed distribution for a given gender/race combination
Description
This function should usually not be called directly by the user. It is used byhttkpop_generate() in "virtual-individuals" mode.
Usage
age_draw_smooth(gender, reth, nsamp, agelim_months, nhanes_mec_svy)Arguments
gender | Gender. Either 'Male' or 'Female'. |
reth | Race/ethnicity. One of 'Mexican American', 'Other Hispanic','Non-Hispanic Black', 'Non-Hispanic White', 'Other'. |
nsamp | Number of ages to draw. |
agelim_months | Two-element numeric vector giving the minimum andmaximum ages in months to include. |
nhanes_mec_svy |
|
Value
A named list with members 'ages_months' and 'ages_years', eachnumeric of lengthnsamp, giving the sampled ages in months and years.
Author(s)
Caroline Ring
References
Ring CL, Pearce RG, Setzer RW, Wetmore BA, Wambaugh JF (2017).“Identifying populations sensitive to environmental chemicals by simulating toxicokinetic variability.”Environment International,106, 105–118.doi:10.1016/j.envint.2017.06.004.
Correct the measured intrinsive hepatic clearance for fraction free
Description
This function uses the free fraction estimated from Kilford et al. (2008) to increase the in vitro measure intrinsic hepatic clearance. The assumptionthat chemical that is bound in vitro is not available to be metabolized andtherefore the actual rate of clearance is actually faster. Note that in mosthigh throughput TK models included in the package this increase is offset bythe assumption of "restrictive clearance" – that is, the rate of hepaticmetabolism is slowed to account for the free fraction of chemical in plasma.This adjustment was made starting in Wetmore et al. (2015) in order to betterpredict plasma concentrations.
Usage
apply_clint_adjustment( Clint, Fu_hep = NULL, Pow = NULL, pKa_Donor = NULL, pKa_Accept = NULL, suppress.messages = FALSE)Arguments
Clint | In vitro measured intrinsic hepatic clearance in units of(ul/min/million hepatocytes). |
Fu_hep | Estimated fraction of chemical free for metabolism in the in vitro assay, estimated by default from the method of Kilford et al. (2008)using |
Pow | The octanal:water equilibrium partition coefficient |
pKa_Donor | A string containing hydrogen donor ionization equilibria, concatenated with commas. Can be "NA" if none exist. |
pKa_Accept | A string containing hydrogen acceptance ionization equilibria, concatenated with commas. Can be "NA" if none exist. |
suppress.messages | Whether or not the output message is suppressed. |
Value
Intrinsic hepatic clearance increased to take into account bindingin the in vitro assay
Author(s)
John Wambaugh
References
Kilford PJ, Gertz M, Houston JB, Galetin A (2008).“Hepatocellular binding of drugs: correction for unbound fraction in hepatocyte incubations using microsomal binding or drug lipophilicity data.”Drug Metabolism and Disposition,36(7), 1194–1197.doi:10.1124/dmd.108.020834. Wetmore BA, Wambaugh JF, Allen B, Ferguson SS, Sochaski MA, Setzer RW, Houck KA, Strope CL, Cantwell K, Judson RS, others (2015).“Incorporating high-throughput exposure predictions with dosimetry-adjusted in vitro bioactivity to inform chemical toxicity testing.”Toxicological Sciences,148(1), 121–136.doi:10.1093/toxsci/kfv171.
See Also
Correct the measured fraction unbound in plasma for lipid binding
Description
This function uses the lipid binding correction estimated by Pearceet al. (2017) to decrease the fraction unbound in plasma(fup). This correctionassumes that there is additional in vivo binding to lipid, whichhas a greater impact on neutral lipophilic compounds.
Usage
apply_fup_adjustment( fup, fup.correction = NULL, Pow = NULL, pKa_Donor = NULL, pKa_Accept = NULL, suppress.messages = FALSE, minimum.Funbound.plasma = 1e-04)Arguments
fup | In vitro measured fraction unbound in plasma |
fup.correction | Estimated correction to account for additional lipidbinding in vivo (Pearce et al., 2017) from |
Pow | The octanal:water equilibrium partition coefficient |
pKa_Donor | A string containing hydrogen donor ionization equilibria, concatenated with commas. Can be "NA" if none exist. |
pKa_Accept | A string containing hydrogen acceptance ionization equilibria, concatenated with commas. Can be "NA" if none exist. |
suppress.messages | Whether or not the output message is suppressed. |
minimum.Funbound.plasma | fup is not allowed to drop below this value (default is 0.0001). |
Value
Fraction unbound in plasma adjusted to take into account bindingin the in vitro assay
Author(s)
John Wambaugh
References
Kilford PJ, Gertz M, Houston JB, Galetin A (2008).“Hepatocellular binding of drugs: correction for unbound fraction in hepatocyte incubations using microsomal binding or drug lipophilicity data.”Drug Metabolism and Disposition,36(7), 1194–1197.doi:10.1124/dmd.108.020834. Wetmore BA, Wambaugh JF, Allen B, Ferguson SS, Sochaski MA, Setzer RW, Houck KA, Strope CL, Cantwell K, Judson RS, others (2015).“Incorporating high-throughput exposure predictions with dosimetry-adjusted in vitro bioactivity to inform chemical toxicity testing.”Toxicological Sciences,148(1), 121–136.doi:10.1093/toxsci/kfv171.
See Also
Estimate well surface area
Description
Estimate geometry surface area of plastic in well plate based on well plateformat suggested values from Corning. option.plastic == TRUE (default) givenonzero surface area (sarea, m^2) option.bottom == TRUE (default) includessurface area of the bottom of the well in determining sarea. Optionallyinclude user values for working volume (v_working, m^3) and surface area.
Usage
armitage_estimate_sarea( tcdata = NA, user_assay_parameters = NA, this.well_number = 384, this.cell_yield = NA, this.v_working = NA)Arguments
tcdata | A data table with well_number corresponding to plate format,optionally include v_working, sarea, option.bottom, and option.plastic OR with assay_component_endpoint_name corresponding to an entry in invitro.assay.params. |
user_assay_parameters | option to fill in your own assay parameters (data table) |
this.well_number | For single value, plate format default is 384, usedif is.na(tcdata)==TRUE |
this.cell_yield | For single value, optionally supply cell_yield,otherwise estimated based on well number |
this.v_working | For single value, optionally supply working volume,otherwise estimated based on well number (m^3) |
Value
A data table composed of any input data.tabletcdatawith only the following columns either created or altered by this function:
| Column Name | Description | Units |
| well_number | number of wells on plate | |
| sarea | surface area | m^2 |
| cell_yield | number of cells | cells |
| v_working | working (filled) volume of each well | uL |
| v_total | total volume of each well | uL |
Author(s)
Greg Honda, Meredith Scherer
References
Armitage JM, Wania F, Arnot JA (2014).“Application of mass balance models and the chemical activity concept to facilitate the use of in vitro toxicity data for risk assessment.”Environmental science & technology,48(16), 9770–9779.doi:10.1021/es501955g.
Armitage In Vitro Distribution Model
Description
Evaluate the Armitage model for chemical distributonin vitro. Takes inputas data table or vectors of values. Outputs a data table. Updates overthe model published in Armitage et al. (2014) include binding to plastic wallsand lipid and protein compartments in cells.
Usage
armitage_eval( chem.cas = NULL, chem.name = NULL, dtxsid = NULL, casrn.vector = NA_character_, nomconc.vector = 1, this.well_number = 384, this.FBSf = NA_real_, tcdata = NA, user_assay_parameters = NA, this.sarea = NA_real_, this.v_total = NA_real_, this.v_working = NA_real_, this.cell_yield = NA_real_, this.Tsys = 37, this.Tref = 298.15, this.option.kbsa2 = FALSE, this.option.swat2 = FALSE, this.option.kpl2 = FALSE, this.option.bottom = TRUE, this.pseudooct = 0.01, this.memblip = 0.04, this.nlom = 0.05, this.P_nlom = 0.035, this.P_dom = 0.05, this.P_cells = 1, this.cell_pH = 7.4, this.Anionic_VF = 0.175, this.A_Prop_acid = 0.05, this.A_Prop_base = 20, this.Lyso_VF = 0.0068, this.Lyso_Diam = 500, this.Lyso_pH = 5.1, this.csalt = 0.15, this.celldensity = 1, this.cellmass = 3, this.f_oc = 1, this.conc_ser_alb = 24, this.conc_ser_lip = 1.9, this.Vdom = 0, this.pH = 7, restrict.ion.partitioning = FALSE, surface.area.switch = TRUE)Arguments
chem.cas | A single or vector of Chemical Abstracts Service Registry Number(s) (CAS-RN) of desired chemical(s). |
chem.name | A single or vector of name(s)) of desired chemical(s). |
dtxsid | A single or vector ofEPA's DSSTox Structure ID(s) (https://comptox.epa.gov/dashboard) |
casrn.vector | A deprecated argument specifying a single or vector of Chemical Abstracts Service Registry Number(s) (CAS-RN) of desired chemical(s). |
nomconc.vector | For vector or single value, micromolar (uM = mol/L) nominal concentration (e.g. AC50 value) |
this.well_number | For single value, plate format default is 384, usedif is.na(tcdata)==TRUE. This value chooses default surface area settings for |
this.FBSf | Fraction fetal bovine serum, must be entered by user. |
tcdata | A data.table with casrn, nomconc, MP, gkow, gkaw, gswat, sarea,v_total, v_working. Otherwise supply single values to this.params (e.g., this.sarea,this.v_total, etc.). Chemical parameters are taken from |
user_assay_parameters | option to fill in your own assay parameters (data table) |
this.sarea | Surface area per well (m^2) |
this.v_total | Total volume per well (uL) |
this.v_working | Working volume per well (uL) |
this.cell_yield | Number of cells per well |
this.Tsys | System temperature (degrees C) |
this.Tref | Reference temperature (degrees K) |
this.option.kbsa2 | Use alternative bovine-serum-albumin partitioningmodel |
this.option.swat2 | Use alternative water solubility correction |
this.option.kpl2 | Use alternative plastic-water partitioning model |
this.option.bottom | Include the bottom of the well in surface area calculation |
this.pseudooct | Pseudo-octanol cell storage lipid content |
this.memblip | Membrane lipid content of cells |
this.nlom | Structural protein content of cells |
this.P_nlom | Proportionality constant to octanol structural protein |
this.P_dom | Proportionality constant to dissolve organic material |
this.P_cells | Proportionality constant to octanol storage lipid |
this.cell_pH | 7.4, pH of cell |
this.Anionic_VF | Anionic phospholipid fraction |
this.A_Prop_acid | Sorption to anionic lipids - acidic chemicals |
this.A_Prop_base | Sorption to anionic lipids - basic chemicals |
this.Lyso_VF | lysosome volume fraction |
this.Lyso_Diam | diameter of lysosome (500 nm) |
this.Lyso_pH | pH of lysosome (5.1) |
this.csalt | Ionic strength of buffer (M = mol/L) |
this.celldensity | Cell density kg/L, g/mL |
this.cellmass | Mass per cell, ng/cell |
this.f_oc | Everything assumed to be like proteins |
this.conc_ser_alb | Mass concentration of albumin in serum (g/L) |
this.conc_ser_lip | Mass concentration of lipids in serum (g/L) |
this.Vdom | 0 ml, the volume of dissolved organic matter (DOM) |
this.pH | pH of cell culture |
restrict.ion.partitioning | FALSE, Should we restrict the chemical available to partition to only the neutral fraction? |
surface.area.switch | TRUE, automatically calculates surface area, switch to FALSE if user provided |
Value
| Param | Description | Units |
| casrn | Chemical Abstracts Service Registry Number | character |
| nomconc | Nominal Concentration | uM=umol/L |
| well_number | Number of wells in plate (used to set default surface area) | unitless |
| sarea | Surface area of well | m^2 |
| v_total | Total volume of well | uL |
| v_working | Filled volume of well | uL |
| cell_yield | Number of cells | cells |
| assay_component_endpoint_name | link to invitro.assay.params table | character |
| gkow | The log10 octanol to water (PC) (logP) | log10 unitless ratio |
| logHenry | The log10 Henry's law constant ' | log10 unitless ratio |
| gswat | The log10 water solubility (logWSol) | log10 mg/L |
| MP_C | The chemical compound melting point | degrees Celcius |
| MP_K | The chemical compound melting point | degrees Kelvin |
| MW | The chemical compound molecular weight | g/mol |
| gkaw | The air to water PC | unitless ratio |
| duow | internal energy of phase change for octanol-water | J/mol |
| duaw | internal energy of phase change for air-water | J/mol |
| gkmw | The log10 membrane to water PC | log10 unitless ratio |
| gkcw | The log10 cell/tissue to water PC | log10 unitless ratio |
| gkbsa | The log10 bovine serum albumin to water PC | log10 unitless ratio |
| gkpl | The log10 plastic to water PC | log10 m2/m2 |
| ksalt | Setschenow constant | L/mol |
| Tsys | System temperature | degrees C |
| Tref | Reference temperature | degrees K |
| option.kbsa2 | Use alternative bovine-serum-albumin partitioning model | logical |
| option.swat2 | Use alternative water solubility correction | logical |
| option.kpl2 | Use alternative plastic-water partitioning model | logical |
| FBSf | Fraction fetal bovine serum | unitless |
| pseudooct | Pseudo-octanol cell storage lipid content | |
| memblip | Membrane lipid content of cells | unitless |
| nlom | Structural protein content of cells | unitless |
| P_nlom | Proportionality constant to octanol structural protein | unitless |
| P_dom | Proportionality constant to dissolved organic material (DOM) | unitless |
| P_cells | Proportionality constant to octanol storage lipid | unitless |
| Anionic_VF | Anionic phospholipid fraction | unitless |
| A_Prop_acid | Sorption to anionic lipids - acidic chemicals | unitless |
| A_Prop_base | Sorption to anionic lipids - basic chemicals | unitless |
| Lyso_VF | Lysosome volume fraction | unitless |
| Lyso_Diam | Diameter of lysosome | nm |
| Lyso_pH | pH of lysosome | unitless |
| csalt | Ionic strength of buffer | M=mol/L |
| celldensity | Cell density | kg/L, g/mL |
| cellmass | Mass per cell | ng/cell |
| f_oc | Indicates fraction of dissolved organic matter to be treated like proteins | unitless |
| cellwat | Fraction of the cell made up of water | unitless |
| Tcor | Temperature correction | |
| Vm | Volume of media | L |
| Vwell | Volume of medium (aqueous phase only) | L |
| Vair | Volume of head space | L |
| Vcells | Volume of cells/tissue | L |
| Valb | Volume of serum albumin | L |
| Vslip | Volume of serum lipids | L |
| Vdom | Volume of dissolved organic matter | L |
| F_ratio | Fugacity ratio | unitless |
| kmw | The membrane to water PC (i.e., 10^gkmow | unitless |
| kow | The octanol to water PC (i.e., 10^gkow) | unitless |
| kaw | The air to water PC (i.e., 10^gkaw) | unitless |
| swat | The intrinsic water solubility (i.e., 10^gswat) | mg/L |
| kpl | The plastic to water PC (i.e., 10^gkpl) | m3/m2 |
| kcw | The cell/tissue to water PC (i.e., 10^gkcw) | unitless |
| kbsa | The bovine serum albumin to water PC | unitless |
| swat_L | Water solubility limit used for Fugacity ratio calculation | |
| mtot | Total micromoles | umol |
| cwat | Total concentration in water | uM=umol/L |
| cwat_s | Dissolved concentration in water | uM=umol/L |
| csat | Is the solution saturated (1/0) | logical |
| activity | Chemical activity; indicates the potential for baseline toxicity to occur | |
| cair | Concentration in head space | uM=umol/L |
| calb | Concentration in serum albumin | uM=umol/L |
| cslip | Concentration in serum lipids | uM=umol/L |
| cdom | Concentration in dissolved organic matter | uM=umol/L |
| ccells | Concentration in cells | uM=umol/L |
| cplastic | Concentration in plastic | uM=umol/m^2 |
| mwat_s | Mass dissolved in water | umols |
| mair | Mass in air/head space | umols |
| mbsa | Mass bound to bovine serum albumin | umols |
| mslip | Mass bound to serum lipids | umols |
| mdom | Mass bound to dissolved organic matter | umols |
| mcells | Mass in cells | umols |
| mplastic | Mass bond to plastic | umols |
| mprecip | Mass precipitated out of solution | umols |
| xwat_s | Fraction dissolved in water | fraction |
| xair | Fraction in the air | fraction |
| xbsa | Fraction bound to bovine serum albumin | fraction |
| xslip | Fraction bound to serum lipids | fraction |
| xdom | Fraction bound to dissolved organic matter | fraction |
| xcells | Fraction within cells | fraction |
| xplastic | Fraction bound to plastic | fraction |
| xprecip | Fraction precipitated out of solution | fraction |
| eta_free | Effective availability ratio | fraction |
| cfree.invitro | Free concentration in the in vitro media (use for Honda1 and Honda2) | fraction |
Author(s)
Greg Honda, Meredith Scherer adapted from code by James Armitage, Jon Arnot
References
Armitage JM, Wania F, Arnot JA (2014).“Application of mass balance models and the chemical activity concept to facilitate the use of in vitro toxicity data for risk assessment.”Environmental science & technology,48(16), 9770–9779.doi:10.1021/es501955g.
Honda GS, Pearce RG, Pham LL, Setzer RW, Wetmore BA, Sipes NS, Gilbert J, Franz B, Thomas RS, Wambaugh JF (2019).“Using the concordance of in vitro and in vivo data to evaluate extrapolation assumptions.”PloS one,14(5), e0217564.doi:10.1371/journal.pone.0217564.
Examples
library(httk)# Check to see if we have info on the chemical:"80-05-7" %in% get_cheminfo()#We do:temp <- armitage_eval(casrn.vector = c("80-05-7", "81-81-2"), this.FBSf = 0.1,this.well_number = 384, nomconc = 10)print(temp$cfree.invitro)# Check to see if we have info on the chemical:"793-24-8" %in% get_cheminfo()# Since we don't have any info, let's look up phys-chem from dashboard:cheminfo <- data.frame( Compound="6-PPD", CASRN="793-24-8", DTXSID="DTXSID9025114", logP=4.27, logHenry=log10(7.69e-8), logWSol=log10(1.58e-4), MP=99.4, MW=268.404 ) # Add the information to HTTK's database:chem.physical_and_invitro.data <- add_chemtable( cheminfo, current.table=chem.physical_and_invitro.data, data.list=list( Compound="Compound", CAS="CASRN", DTXSID="DTXSID", MW="MW", logP="logP", logHenry="logHenry", logWSol="logWSol", MP="MP"), species="Human", reference="CompTox Dashboard 31921")# Run the Armitage et al. (2014) model:out <- armitage_eval( casrn.vector = "793-24-8", this.FBSf = 0.1, this.well_number = 384, nomconc = 10) print(out)Add a parameter value to the chem.physical_and_invitro.data table
Description
This internal function is used byadd_chemtable to add a single new parameter to the table of chemical parameters. It should not be typicallyused from the command line.
Usage
augment.table( this.table, this.CAS, compound.name = NULL, this.property, value, species = NULL, reference, overwrite = FALSE, sig.fig = 4, clint.pvalue.overwrite = TRUE, allow.na = FALSE, suppress.messages = FALSE)Arguments
this.table | Object of class data.frame containing one row per chemical. |
this.CAS | The Chemical Abstracts Service registry number (CAS-RN)correponding to the parameter value |
compound.name | A name associated with the chemical (defaults to NULL) |
this.property | The property being added/modified. |
value | The value being assigned to this.property. |
species | This is the species for the data in the new table. This maybe omitted if a column in data.list gives the species value for eachchemical or if the data are not species-specific (e.g., MW). |
reference | This is the reference for the data in the new table. Thismay be omitted if a column in data.list gives the reference value for eachchemical. |
overwrite | If overwrite=TRUE then data in current.table will bereplaced by any data in new.table that is for the same chemical andproperty. If overwrite=FALSE (DEFAULT) then new data for the same chemicaland property are ignored. Funbound.plasma values of 0 (below limit ofdetection) are overwritten either way. |
sig.fig | Sets the number of significant figures stored (defaults to 4) |
clint.pvalue.overwrite | If TRUE then the Cl_int p-value is set to NA when the Cl_int value is changed unless a new p-value is provided. (defaultsto TRUE) |
allow.na | If TRUE (default is FALSE) then NA values are written to thetable, otherwise they are ignored. |
suppress.messages | Whether or not the output messages are suppressed. |
Value
data.frame | A new data.frame containing the data incurrent.table augmented by new.table |
Author(s)
John Wambaugh
Find the best available ratio of the blood to plasma concentration constant.
Description
This function finds the best available constant ratio of the bloodconcentration to the plasma concentration, usingget_rblood2plasma andcalc_rblood2plasma.
Usage
available_rblood2plasma( chem.cas = NULL, chem.name = NULL, dtxsid = NULL, species = "Human", adjusted.Funbound.plasma = TRUE, class.exclude = TRUE, suppress.messages = FALSE)Arguments
chem.cas | Either the CAS number or the chemical name must bespecified. |
chem.name | Either the chemical name or the CAS number must bespecified. |
dtxsid | EPA's 'DSSTox Structure ID (https://comptox.epa.gov/dashboard)the chemical must be identified by either CAS, name, or DTXSIDs |
species | Species desired (either "Rat", "Rabbit", "Dog", "Mouse", ordefault "Human"). |
adjusted.Funbound.plasma | Whether or not to use Funbound.plasmaadjustment if calculating Rblood2plasma. |
class.exclude | Exclude chemical classes identified as outside of domain of applicability by relevant modelinfo_[MODEL] file (default TRUE). |
suppress.messages | Whether or not to display relevant warning messagesto user. |
Details
Either retrieves a measured blood:plasma concentration ratio from thechem.physical_and_invitro.data table or calculates it using the red blood cellpartition coefficient predicted with Schmitt's method
If available, in vivo data (fromchem.physical_and_invitro.data) for thegiven species is returned, substituting the human in vivo value when missingfor other species. In the absence of in vivo data, the value is calculatedwithcalc_rblood2plasma for the given species. If Funbound.plasma isunvailable for the given species, the human Funbound.plasma is substituted.If none of these are available, the mean human Rblood2plasma fromchem.physical_and_invitro.data is returned. details than the description above ~~
Value
The blood to plasma chemical concentration ratio – measured if available,calculated if not.
Author(s)
Robert Pearce
See Also
Examples
available_rblood2plasma(chem.name="Bisphenol A",adjusted.Funbound.plasma=FALSE)available_rblood2plasma(chem.name="Bisphenol A",species="Rat")Assess the current performance of httk relative to historical benchmarks
Description
The function performs a series of "sanity checks" and predictive performancebenchmarks so that the impact of changes to the data, models, and implementation of the R package can be tested. Plots can be generated showing how the performance of the current version compares with past releases ofhttk.
Usage
benchmark_httk( basic.check = TRUE, calc_mc_css.check = TRUE, in_vivo_stats.check = TRUE, tissuepc.check = TRUE, suppress.messages = TRUE, make.plots = TRUE)Arguments
basic.check | Whether to run the basic checks, including uM and mg/L units for |
calc_mc_css.check | Whether to check the Monte Carlo sample. A comparison of the output of |
in_vivo_stats.check | Whether to compare the outputs of |
tissuepc.check | Whether to compare the tissue-specific partitioncoefficient predictions from the calibrated Schmitt (2008) model to the in vivo data-derived estimates compiled by Pearce et al. (2017). (defaults to TRUE) |
suppress.messages | Whether or not output messages are suppressed(defaults to TRUE) |
make.plots | Whether current benchmarks should be plotted with historical performance (defaults to TRUE) |
Details
Historically some refinements made to one aspect of httk have unintentionallyimpacted other aspects. Most notably errors have occasionally been introduced with respect to units (v1.9, v2.1.0). This benchmarking tool is intended toreduce the chance of these errors occurring in the future.
Past performance was retroactively evaluated by manually installing previous versions of the package fromhttps://cran.r-project.org/src/contrib/Archive/httk/ andthen adding the code forbenchmark_httk at the command lineinterface.
The basic tests are important – if the output units for key functions are wrong, notmuch can be right. Past unit errors were linked to an incorrect unit conversions made within an individual function. Since the usage ofconvert_units became standard throughout httk,unit problems are hopefully less likely.
There are two Monte Carlo tests. One comparescalc_mc_css 95th percentilesteady-state plasma concentrations for a 1 mg/kg/day exposureagainst the Css values calculated by SimCyp and reported in Wetmore et al.(2012,2015). These have gradually diverged as the assumptions for httk haveshifted to better describe non-pharmaceutical, commercial chemicals.
The in vivo tests are in some ways the most important, as they establish theoverall predictability for httk for Cmax, AUC, and Css. The in vivo statistics are currently based on comparisons to the in vivodata compiled by Wambaugh et al. (2018). We see that when the tissuepartition coefficient calibrations were introduced in v1.6 that theoverall predictability for in vivo endpoints was reduced (increased RMSLE).If this phenomena continues as new in vivo evaluation data become available,we may need to revisit whether evaluation against experimentally-derived partition coefficients can actually be used for calibration, or just merelyfor establishing confidence intervals.
The partition coefficient tests provide an important check of the httkimplementation of the Schmitt (2008) model for tissue:plasma equilibrium distribution. These predictions heavily rely on accurate description of tissue composition and the ability to predict the ionization state of thecompounds being modeled.
Value
named list, whose elements depend on the selected checks
| basic | A list with four metrics: N.steadystate -- Number of chemicals with sufficient data for steady-state IVIVE calc_analytic.units -- Ratio of mg/L to uM * 1000 / molecular weight -- should be 1 calc_mc.units -- Ratio should be 1 solve_pbtk.units -- Ratio should be 1 |
| calc_mc_css | A list with four metrics:RMSLE.Wetmore -- Root mean squared log10 error (RMSLE) in predicted Css between literature values (SimCyp, Wetmore et al. 2012,2015) andcalc_mc_cssN.Wetmore -- Number of chemicals in Wetmore comparisonRMSLE.noMC -- RMSLE betweencalc_analytic_css andcalc_mc_css N.noMC -- Number of chemicals in noMC comparison |
| in_vivo_stats | A list with two metrics:RMSLE.InVivoCss -- RMSLE between the predictions ofcalc_analytic_css and in vivo estimates of CssN.InVivoCss -- Number of chemicals in comparison |
| units.plot | A ggplot2 figure showing units tests of various functions. Output is generated for mg/L and uM, and then the ratio mg/L/uM*1000/MW iscalculated. If the units are correct the ratio should be 1 (within the precision of the functions -- usually four significant figures). |
| invivo.rmsle.plot | A ggplot2 figure comparingmodel predictions to in vivo measured values. Output generated is the root mean square log10 error for parameters estimatedby the package. |
| model.rmsle.plot | A ggplot2 figure comparing various functions valuesagainst values predicted by other models (chiefly SimCyp predictions fromWetmore et al. 2012 and 2015. Output generated is the root mean square log10 error for parameters estimatedby the package. |
| count.plot | A ggplot2 figure showing count of chemicals of various functions. Output generated is a count of the chemicals available for the each of theparameters estimated by and used for benchmarking the package. |
Author(s)
John Wambaugh
References
Davidson-Fritz SE, Ring CL, Evans MV, Schacht CM, Chang X, Breen M, Honda GS, Kenyon E, Linakis MW, Meade A, others (2025).“Enabling Transparent Toxicokinetic Modeling for Public Health Risk Assessment.”PLOS ONE,20(4), 1-40.doi:10.1371/journal.pone.0321321.
Find average blood masses by age.
Description
If blood mass fromblood_weight is negative or very small,then just default to the mean blood mass by age. (Geigy Scientific Tables,7th ed.)
Usage
blood_mass_correct(blood_mass, age_months, age_years, gender, weight)Arguments
blood_mass | A vector of blood masses in kg to be replaced withaverages. |
age_months | A vector of ages in months. |
age_years | A vector of ages in years. |
gender | A vector of genders (either 'Male' or 'Female'). |
weight | A vector of body weights in kg. |
Value
A vector of blood masses in kg.
Author(s)
Caroline Ring
References
Geigy Pharmaceuticals, "Scientific Tables", 7th Edition, John Wiley and Sons (1970)
Ring CL, Pearce RG, Setzer RW, Wetmore BA, Wambaugh JF (2017).“Identifying populations sensitive to environmental chemicals by simulating toxicokinetic variability.”Environment International,106, 105–118.doi:10.1016/j.envint.2017.06.004.
Predict blood mass.
Description
Predict blood mass based on body surface area and gender, using equationsfrom Bosgra et al. 2012
Usage
blood_weight(BSA, gender)Arguments
BSA | Body surface area in m^2. May be a vector. |
gender | Either 'Male' or 'Female'. May be a vector. |
Value
A vector of blood masses in kg the same length asBSA andgender.
Author(s)
Caroline Ring
References
Bosgra, Sieto, et al. "An improved model to predict physiologically based model parameters and their inter-individual variability from anthropometry." Critical reviews in toxicology 42.9 (2012): 751-767.
Ring CL, Pearce RG, Setzer RW, Wetmore BA, Wambaugh JF (2017).“Identifying populations sensitive to environmental chemicals by simulating toxicokinetic variability.”Environment International,106, 105–118.doi:10.1016/j.envint.2017.06.004.
CDC BMI-for-age charts
Description
Charts giving the BMI-for-age percentiles for boys and girls ages 2-18
Usage
bmiageFormat
A data.table with 434 rows and 5 variables:
- Sex
Female or Male
- Agemos
Age in months
- P5
The 5thpercentile BMI for the corresponding sex and age
- P85
The 85thpercentile BMI for the corresponding sex and age
- P95
The 95thpercentile BMI for the corresponding sex and age
Details
For children ages 2 to 18, weight class depends on the BMI-for-age percentile.
- Underweight
<5th percentile
- Normal weight
5th-85th percentile
- Overweight
85th-95th percentile
- Obese
>=95th percentile
Author(s)
Caroline Ring
Source
https://www.cdc.gov/growthcharts/data/zscore/bmiagerev.csv
References
Ring CL, Pearce RG, Setzer RW, Wetmore BA, Wambaugh JF (2017).“Identifying populations sensitive to environmental chemicals by simulating toxicokinetic variability.”Environment International,106, 105–118.doi:10.1016/j.envint.2017.06.004.
Predict body surface area.
Description
Predict body surface area from weight, height, and age, using Mosteller'sformula for age>18 and Haycock's formula for age<18
Usage
body_surface_area(BW, H, age_years)Arguments
BW | A vector of body weights in kg. |
H | A vector of heights in cm. |
age_years | A vector of ages in years. |
Value
A vector of body surface areas in cm^2.
Author(s)
Caroline Ring
References
Mosteller, R. D. "Simplified calculation of body surface area." N Engl J Med 317 (1987): 1098..
Haycock, George B., George J. Schwartz, and David H. Wisotsky. "Geometric method for measuring body surface area: a height-weight formula validated in infants, children, and adults." The Journal of pediatrics 93.1 (1978): 62-66.
Ring CL, Pearce RG, Setzer RW, Wetmore BA, Wambaugh JF (2017).“Identifying populations sensitive to environmental chemicals by simulating toxicokinetic variability.”Environment International,106, 105–118.doi:10.1016/j.envint.2017.06.004.
Predict bone mass
Description
Predict bone mass from age_years, height, weight, gender, using logisticequations fit to data from Baxter-Jones et al. 2011, or for infants < 1year, using equation from Koo et al. 2000 (See Price et al. 2003)
Usage
bone_mass_age(age_years, age_months, height, weight, gender)Arguments
age_years | Vector of ages in years. |
age_months | Vector of ages in months. |
height | Vector of heights in cm. |
weight | Vector of body weights in kg. |
gender | Vector of genders, either 'Male' or 'Female'. |
Value
Vector of bone masses.
Author(s)
Caroline Ring
References
Baxter-Jones, Adam DG, et al. "Bone mineral accrual from 8 to 30 years of age: an estimation of peak bone mass." Journal of Bone and Mineral Research 26.8 (2011): 1729-1739.
Koo, Winston WK, and Elaine M. Hockman. "Physiologic predictors of lumbar spine bone mass in neonates." Pediatric research 48.4 (2000): 485-489.
Price, Paul S., et al. "Modeling interindividual variation in physiological factors used in PBPK models of humans." Critical reviews in toxicology 33.5 (2003): 469-503.
Ring CL, Pearce RG, Setzer RW, Wetmore BA, Wambaugh JF (2017).“Identifying populations sensitive to environmental chemicals by simulating toxicokinetic variability.”Environment International,106, 105–118.doi:10.1016/j.envint.2017.06.004.
Predict brain mass.
Description
Predict brain mass from gender and age.
Usage
brain_mass(gender, age_years)Arguments
gender | Vector of genders, either 'Male' or 'Female' |
age_years | Vector of ages in years. |
Value
A vector of brain masses in kg.
Author(s)
Caroline Ring
References
Ring CL, Pearce RG, Setzer RW, Wetmore BA, Wambaugh JF (2017).“Identifying populations sensitive to environmental chemicals by simulating toxicokinetic variability.”Environment International,106, 105–118.doi:10.1016/j.envint.2017.06.004.
Calculate the analytic steady state plasma concentration.
Description
This function calculates the analytic steady state plasma or venous blood concentrations as a result of infusion dosing for the three compartment and multiple compartment PBTK models.
Usage
calc_analytic_css( chem.name = NULL, chem.cas = NULL, dtxsid = NULL, parameters = NULL, species = "human", daily.dose = NULL, dose = 1, dose.units = "mg/kg/day", route = "oral", output.units = "uM", model = "pbtk", concentration = "plasma", suppress.messages = FALSE, tissue = NULL, bioactive.free.invivo = FALSE, IVIVE = NULL, parameterize.args.list = list(), ...)Arguments
chem.name | Either the chemical name, CAS number, or the parameters must be specified. |
chem.cas | Either the chemical name, CAS number, or the parameters must be specified. |
dtxsid | EPA's DSSTox Structure ID (https://comptox.epa.gov/dashboard)the chemical must be identified by either CAS, name, or DTXSIDs |
parameters | Chemical parameters from parameterize_pbtk (for model = 'pbtk'), parameterize_3comp (for model = '3compartment), parameterize_1comp(for model = '1compartment') or parameterize_steadystate (for model = '3compartmentss'), overrides chem.name and chem.cas. |
species | Species desired (either "Rat", "Rabbit", "Dog", "Mouse", ordefault "Human"). |
daily.dose | Total daily dose, mg/kg BW. |
dose | The amount of chemial to which the individual is exposed. |
dose.units | The units associated with the dose received. |
route | Route of exposure (either "oral", "iv", or "inhalation"default "oral"). |
output.units | Units for returned concentrations, defaults to uM (specify units = "uM") but can also be mg/L. |
model | Model used in calculation,'gas_pbtk' for the gas pbtk model, 'pbtk' for the multiple compartment model,'3compartment' for the three compartment model, '3compartmentss' for the three compartment steady state model, and '1compartment' for one compartment model. |
concentration | Desired concentration type: 'blood','tissue', or default 'plasma'. In the case that the concentration is for plasma, selecting "blood"will use the blood:plasma ratio to estimate blood concentration. In the casethat the argument 'tissue' specifies a particular tissue of the body, concentration defaults to 'tissue' – that is, the concentration in the If cocentration is set to 'blood' or 'plasma' and 'tissue' specifies aspecific tissue then the value returned is for the plasma or blood in thatspecific tissue. |
suppress.messages | Whether or not the output message is suppressed. |
tissue | Desired steady state tissue concentration. Default is of NULLtypically gives whole body plasma concentration. |
bioactive.free.invivo | If FALSE (default), then the total concentration is treatedas bioactive in vivo. If TRUE, the the unbound (free) plasma concentration is treated as bioactive in vivo. Only works with tissue = NULL in current implementation. |
IVIVE | Honda et al. (2019) identified four plausible sets of assumptions forin vitro-in vivo extrapolation (IVIVE) assumptions. Argument may be set to "Honda1" through "Honda4". If used, this function overwrites the tissue, restrictive.clearance, and bioactive.free.invivo arguments. See Details below for more information. |
parameterize.args.list | List of arguments passed to model's associatedparameterization function, including default.to.human, adjusted.Funbound.plasma, regression, and minimum.Funbound.plasma. The default.to.human argument substitutes missing animal values with human valuesif true, adjusted.Funbound.plasma returns adjusted Funbound.plasma when set to TRUE along with parition coefficients calculated with this value, regression indicates whether or not to use the regressions in calculatingpartition coefficients, and minimum.Funbound.plasma is the value to whichMonte Carlo draws less than this value are set (default is 0.0001 – halfthe lowest measured Fup in our dataset). |
... | Additional parameters passed to parameterize function if parameters is NULL. |
parameterize.args | Additional parameters passed to parameterize function if parameters is NULL. |
Details
Concentrations are calculated for the specifed model with constant oral infusion dosing. All tissues other than gut, liver, and lung are the product of the steady state plasma concentration and the tissue to plasma partition coefficient.
Only four sets of IVIVE assumptions that performed well in Honda et al. (2019) are currently included inhonda.ivive:"Honda1" through "Honda4". The use of max (peak) concentration can not be currently be calculated withcalc_analytic_css. The httk default settings correspond to "Honda3":
| In Vivo Conc. | Metabolic Clearance | Bioactive Chemical Conc.In Vivo | TK Statistic Used* | Bioactive Chemical Conc.In Vitro | |
| Honda1 | Veinous (Plasma) | Restrictive | Free | Mean Conc. In Vivo | Free Conc. In Vitro |
| Honda2 | Veinous | Restrictive | Free | Mean Conc. In Vivo | Nominal Conc. In Vitro |
| Honda3 | Veinous | Restrictive | Total | Mean Conc. In Vivo | Nominal Conc. In Vitro |
| Honda4 | Target Tissue | Non-restrictive | Total | Mean Conc. In Vivo | Nominal Conc. In Vitro |
"Honda1" uses plasma concentration, restrictive clearance, and treats the unbound invivo concentration as bioactive. For IVIVE, any input nominal concentration in vitro should be converted to cfree.invitro usingarmitage_eval, otherwise performance will be the same as "Honda2".
Value
Steady state plasma concentration in specified units
Author(s)
Robert Pearce, John Wambaugh, Greg Honda, Miyuki Breen
References
Honda GS, Pearce RG, Pham LL, Setzer RW, Wetmore BA, Sipes NS, Gilbert J, Franz B, Thomas RS, Wambaugh JF (2019).“Using the concordance of in vitro and in vivo data to evaluate extrapolation assumptions.”PloS one,14(5), e0217564.doi:10.1371/journal.pone.0217564.
See Also
Examples
calc_analytic_css(chem.name='Bisphenol-A',output.units='mg/L', model='3compartment',concentration='blood')# Test that the underlying PK models give the same answers:calc_analytic_css(chem.cas="15972-60-8")calc_analytic_css(chem.cas="15972-60-8",model="1compartment")calc_analytic_css(chem.cas="15972-60-8",model="pbtk")calc_analytic_css(chem.cas="15972-60-8",model="3compartment")calc_analytic_css(chem.name='Bisphenol-A',tissue='liver',species='rabbit', parameterize.args.list = list( default.to.human=TRUE, adjusted.Funbound.plasma=TRUE, regression=TRUE, minimum.Funbound.plasma=1e-4),daily.dose=2)calc_analytic_css(chem.name="bisphenol a",model="1compartment")calc_analytic_css(chem.cas="80-05-7",model="3compartmentss")params <- parameterize_pbtk(chem.cas="80-05-7") calc_analytic_css(parameters=params,model="pbtk")# Try various chemicals with differing parameter sources/issues:calc_analytic_css(chem.name="Betaxolol")calc_analytic_css(chem.name="Tacrine",model="pbtk")calc_analytic_css(chem.name="Dicofol",model="1compartment")calc_analytic_css(chem.name="Diflubenzuron",model="3compartment")calc_analytic_css(chem.name="Theobromine",model="3compartmentss")# permutations on steady-state for the 1compartment modelcalc_analytic_css(chem.name="bisphenol a", model="1compartment")calc_analytic_css(chem.cas="80-05-7", model="1compartment")calc_analytic_css(parameters=parameterize_1comp(chem.cas="80-05-7"), model="1compartment")calc_analytic_css(chem.cas="80-05-7", model="1compartment", tissue="liver")calc_analytic_css(chem.cas="80-05-7", model="1compartment", tissue="brain")# permutations on steady-state for the 3compartment modelcalc_analytic_css(chem.cas="80-05-7", model="3compartment")calc_analytic_css(parameters=parameterize_3comp(chem.cas="80-05-7"), model="3compartment")calc_analytic_css(chem.name="bisphenol a", model="3compartment", tissue="liver")calc_analytic_css(chem.name="bisphenol a", model="3compartment", tissue="brain")# permurtations on steady-state for the pbtk model:calc_analytic_css(chem.cas="80-05-7", model="pbtk")calc_analytic_css(parameters=parameterize_pbtk(chem.cas="80-05-7"), model="pbtk")calc_analytic_css(chem.name="bisphenol a", model="pbtk", tissue="liver")calc_analytic_css(chem.name="bisphenol a", model="pbtk", tissue="brain")# Test oral absorption functionality:# By default we now include calculation of Fabs and Fgut (always had Fhep):calc_analytic_css(chem.name="bisphenol a", model="pbtk")# Therefore if we set Fabs = Fgut = 1 with keetit100=TRUE, we should get a# higher predicted plasma steady-state concentration:calc_analytic_css(chem.name="bisphenol a", model="pbtk", Caco2.options=list(keepit100=TRUE))Calculate the analytic steady state concentration for the one compartment model.
Description
This function calculates the analytic steady state plasma or venous blood concentrations as a result of infusion dosing.
Usage
calc_analytic_css_1comp( chem.name = NULL, chem.cas = NULL, dtxsid = NULL, species = "Human", parameters = NULL, dosing = list(daily.dose = 1), hourly.dose = NULL, dose.units = "mg", concentration = "plasma", suppress.messages = FALSE, recalc.blood2plasma = FALSE, tissue = NULL, restrictive.clearance = TRUE, bioactive.free.invivo = FALSE, Caco2.options = list(), ...)Arguments
chem.name | Either the chemical name, CAS number, or the parameters must be specified. |
chem.cas | Either the chemical name, CAS number, or the parameters must be specified. |
dtxsid | EPA's 'DSSTox Structure ID (https://comptox.epa.gov/dashboard)the chemical must be identified by either CAS, name, or DTXSIDs |
species | Species desired (either "Rat", "Rabbit", "Dog", "Mouse", ordefault "Human"). |
parameters | Chemical parameters from parameterize_pbtk (for model = 'pbtk'), parameterize_3comp (for model = '3compartment), parameterize_1comp(for model = '1compartment') or parameterize_steadystate (for model = '3compartmentss'), overrides chem.name and chem.cas. |
dosing | List of dosing metrics used in simulation, which includesthe namesake entries of a model's associated dosing.params. For steady-statecalculations this is likely to be either "daily.dose" for oral exposures or"Cinhaled" for inhalation. |
hourly.dose | Hourly dose rate mg/kg BW/h. |
dose.units | The units associated with the dose received. |
concentration | Desired concentration type, 'blood' or default 'plasma'. |
suppress.messages | Whether or not the output message is suppressed. |
recalc.blood2plasma | Recalculates the ratio of the amount of chemical in the blood to plasma using the input parameters. Use this if you have altered hematocrit, Funbound.plasma, or Krbc2pu. |
tissue | Desired tissue conentration (defaults to whole body concentration.) |
restrictive.clearance | If TRUE (default), then only the fraction ofchemical not bound to protein is available for metabolism in the liver. If FALSE, then all chemical in the liver is metabolized (faster metabolism dueto rapid off-binding). |
bioactive.free.invivo | If FALSE (default), then the total concentration is treatedas bioactive in vivo. If TRUE, the the unbound (free) plasma concentration is treated as bioactive in vivo. Only works with tissue = NULL in current implementation. |
Caco2.options | A list of options to use when working with Caco2 apical tobasolateral data |
... | Additional parameters passed to parameterize function if parameters is NULL. |
Value
Steady state plasma concentration in mg/L units
Author(s)
Robert Pearce and John Wambaugh
See Also
Calculate the analytic steady state concentration for model 3compartment
Description
This function calculates the analytic steady state plasma or blood concentrations as a result of constant oral infusion dosing.The three compartment model (Pearce et al. 2017)describes the amount of chemical inthree key tissues of the body: the liver, the portal vein (essentially, oral absorptionfrom the gut), and a systemic compartment ("sc") representing the rest of the body.Seesolve_3comp for additional details. The analyticalsteady-state solution for the the three compartment model is:
C^{ss}_{plasma} = \frac{dose}{f_{up}*Q_{GFR} + Cl_{h} + \frac{Cl_{h}}{Q_{l}}\frac{f_{up}}{R_{b:p}}Q_{GFR}}
C^{ss}_{blood} = R_{b:p}*C^{ss}_{plasma}
where Q_GFR is the glomerular filtrationrate in the kidney, Q_l is the total liver blood flow (hepatic artery plustotal vein),Cl_h is the chemical-specific whole liver metabolism clearance (scaled up from intrinsic clearance, which does not depend on flow),f_up is the chemical-specific fraction unbound in plasma, R_b:p is the chemical specific ratio of concentrations in blood:plasma.
Usage
calc_analytic_css_3comp( chem.name = NULL, chem.cas = NULL, dtxsid = NULL, species = "Human", parameters = NULL, dosing = list(daily.dose = 1), hourly.dose = NULL, dose.units = "mg", concentration = "plasma", suppress.messages = FALSE, recalc.blood2plasma = FALSE, tissue = NULL, restrictive.clearance = TRUE, bioactive.free.invivo = FALSE, Caco2.options = list(), ...)Arguments
chem.name | Either the chemical name, CAS number, or the parameters must be specified. |
chem.cas | Either the chemical name, CAS number, or the parameters must be specified. |
dtxsid | EPA's 'DSSTox Structure ID (https://comptox.epa.gov/dashboard)the chemical must be identified by either CAS, name, or DTXSIDs |
species | Species desired (either "Rat", "Rabbit", "Dog", "Mouse", ordefault "Human"). |
parameters | Chemical parameters from parameterize_pbtk (for model = 'pbtk'), parameterize_3comp (for model = '3compartment), parameterize_1comp(for model = '1compartment') or parameterize_steadystate (for model = '3compartmentss'), overrides chem.name and chem.cas. |
dosing | List of dosing metrics used in simulation, which includesthe namesake entries of a model's associated dosing.params. For steady-statecalculations this is likely to be either "daily.dose" for oral exposures or"Cinhaled" for inhalation. |
hourly.dose | Hourly dose rate mg/kg BW/h. |
dose.units | The units associated with the dose received. |
concentration | Desired concentration type, 'blood' or default 'plasma'. |
suppress.messages | Whether or not the output message is suppressed. |
recalc.blood2plasma | Recalculates the ratio of the amount of chemical in the blood to plasma using the input parameters. Use this if you have altered hematocrit, Funbound.plasma, or Krbc2pu. |
tissue | Desired tissue conentration (defaults to whole body concentration.) |
restrictive.clearance | If TRUE (default), then only the fraction ofchemical not bound to protein is available for metabolism in the liver. If FALSE, then all chemical in the liver is metabolized (faster metabolism dueto rapid off-binding). |
bioactive.free.invivo | If FALSE (default), then the total concentration is treatedas bioactive in vivo. If TRUE, the the unbound (free) plasma concentration is treated as bioactive in vivo. Only works with |
Caco2.options | A list of options to use when working with Caco2 apical tobasolateral data |
... | Additional parameters passed to parameterize function if parameters is NULL. |
Value
Steady state plasma concentration in mg/L units
Author(s)
Robert Pearce and John Wambaugh
References
Pearce RG, Setzer RW, Strope CL, Wambaugh JF, Sipes NS (2017).“Httk: R package for high-throughput toxicokinetics.”Journal of Statistical Software,79(4), 1.doi:10.18637/jss.v079.i04.
See Also
Calculate the analytic steady state concentration for model 3compartment
Description
This function calculates the analytic steady state plasma or blood concentrations as a result of constant oral infusion dosing.The three compartment model (Pearce et al. 2017)describes the amount of chemical inthree key tissues of the body: the liver, the portal vein (essentially, oral absorptionfrom the gut), and a systemic compartment ("sc") representing the rest of the body.Seesolve_3comp for additional details. The analyticalsteady-state solution for the the three compartment model is:
C^{ss}_{plasma} = \frac{dose}{f_{up}*Q_{GFR} + Cl_{h} + \frac{Cl_{h}}{Q_{l}}\frac{f_{up}}{R_{b:p}}Q_{GFR}}
C^{ss}_{blood} = R_{b:p}*C^{ss}_{plasma}
where Q_GFR is the glomerular filtrationrate in the kidney, Q_l is the total liver blood flow (hepatic artery plustotal vein),Cl_h is the chemical-specific whole liver metabolism clearance (scaled up from intrinsic clearance, which does not depend on flow),f_up is the chemical-specific fraction unbound in plasma, R_b:p is the chemical specific ratio of concentrations in blood:plasma.
Usage
calc_analytic_css_3comp2( chem.name = NULL, chem.cas = NULL, dtxsid = NULL, species = "Human", parameters = NULL, dosing = list(daily.dose = 1), hourly.dose = NULL, dose.units = "mg", concentration = "plasma", suppress.messages = FALSE, recalc.blood2plasma = FALSE, tissue = NULL, route = "oral", restrictive.clearance = TRUE, bioactive.free.invivo = FALSE, Caco2.options = list(), exhalation = TRUE, ...)Arguments
chem.name | Either the chemical name, CAS number, or the parameters must be specified. |
chem.cas | Either the chemical name, CAS number, or the parameters must be specified. |
dtxsid | EPA's 'DSSTox Structure ID (https://comptox.epa.gov/dashboard)the chemical must be identified by either CAS, name, or DTXSIDs |
species | Species desired (either "Rat", "Rabbit", "Dog", "Mouse", ordefault "Human"). |
parameters | Chemical parameters from parameterize_pbtk (for model = 'pbtk'), parameterize_3comp (for model = '3compartment), parameterize_1comp(for model = '1compartment') or parameterize_steadystate (for model = '3compartmentss'), overrides chem.name and chem.cas. |
dosing | List of dosing metrics used in simulation, which includesthe namesake entries of a model's associated dosing.params. For steady-statecalculations this is likely to be either "daily.dose" for oral exposures or"Cinhaled" for inhalation. |
hourly.dose | Hourly dose rate mg/kg BW/h. |
dose.units | The units associated with the dose received. |
concentration | Desired concentration type, 'blood' or default 'plasma'. |
suppress.messages | Whether or not the output message is suppressed. |
recalc.blood2plasma | Recalculates the ratio of the amount of chemical in the blood to plasma using the input parameters. Use this if you have altered hematocrit, Funbound.plasma, or Krbc2pu. |
tissue | Desired tissue conentration (defaults to whole body concentration.) |
route | Route of exposure ("inhalation" or [DEFAULT] "oral"). |
restrictive.clearance | If TRUE (default), then only the fraction ofchemical not bound to protein is available for metabolism in the liver. If FALSE, then all chemical in the liver is metabolized (faster metabolism dueto rapid off-binding). |
bioactive.free.invivo | If FALSE (default), then the total concentration is treatedas bioactive in vivo. If TRUE, the the unbound (free) plasma concentration is treated as bioactive in vivo. Only works with |
Caco2.options | A list of options to use when working with Caco2 apical tobasolateral data |
exhalation | A Boolean (TRUE/FALSE) indicating whether exhalation is included as a route of potential clearance (Defaults to TRUE). |
... | Additional parameters passed to parameterize function if parameters is NULL. |
Value
Steady state plasma concentration in mg/L units
Author(s)
Robert Pearce and John Wambaugh
References
Pearce RG, Setzer RW, Strope CL, Wambaugh JF, Sipes NS (2017).“Httk: R package for high-throughput toxicokinetics.”Journal of Statistical Software,79(4), 1.doi:10.18637/jss.v079.i04.
See Also
Calculate the analytic steady state concentration for the three compartmentsteady-state model
Description
This function calculates the steady state plasma or venous blood concentrations as a result of constant oral infusion dosing. The equation, initally used for high throughput in vitro-in vivo extrapolation in(Rotroff et al. 2010) and later given in (Wetmore et al. 2012), assumes that the concentration is the inverse of the total clearance, which is the sum of hepatic metabolismand renal filatrion:
C^{ss}_{plasma} = \frac{dose}{f_{up}*Q_{GFR}+Cl_{h}}
C^{ss}_{blood} = R_{b:p}*C^{ss}_{plasma}
where Q_GFR is the glomerular filtrationrate in the kidney, Cl_h is the chemical-specific whole liver metabolism clearance (scaled up from intrinsic clearance, which does not depend on flow),f_up is the chemical-specific fraction unbound in plasma, R_b:p is the chemical specific ratio of concentrations in blood:plasma.
Usage
calc_analytic_css_3compss( chem.name = NULL, chem.cas = NULL, dtxsid = NULL, parameters = NULL, dosing = list(daily.dose = 1), hourly.dose = NULL, dose.units = "mg", concentration = "plasma", suppress.messages = FALSE, recalc.blood2plasma = FALSE, tissue = NULL, restrictive.clearance = TRUE, bioactive.free.invivo = FALSE, Caco2.options = list(), ...)Arguments
chem.name | Either the chemical name, CAS number, or the parameters must be specified. |
chem.cas | Either the chemical name, CAS number, or the parameters must be specified. |
dtxsid | EPA's 'DSSTox Structure ID (https://comptox.epa.gov/dashboard)the chemical must be identified by either CAS, name, or DTXSIDs |
parameters | Chemical parameters from parameterize_pbtk (for model = 'pbtk'), parameterize_3comp (for model = '3compartment), parameterize_1comp(for model = '1compartment') or parameterize_steadystate (for model = '3compartmentss'), overrides chem.name and chem.cas. |
dosing | List of dosing metrics used in simulation, which includesthe namesake entries of a model's associated dosing.params. For steady-statecalculations this is likely to be either "daily.dose" for oral exposures or"Cinhaled" for inhalation. |
hourly.dose | Hourly dose rate mg/kg BW/h. |
dose.units | The units associated with the dose received. |
concentration | Desired concentration type, 'blood' or default 'plasma'. |
suppress.messages | Whether or not the output message is suppressed. |
recalc.blood2plasma | Recalculates the ratio of the amount of chemical in the blood to plasma using the input parameters. Use this if you have 'altered hematocrit, Funbound.plasma, or Krbc2pu. |
tissue | Desired tissue concentration (defaults to whole body concentration.) |
restrictive.clearance | If TRUE (default), then only the fraction ofchemical not bound to protein is available for metabolism in the liver. If FALSE, then all chemical in the liver is metabolized (faster metabolism dueto rapid off-binding). |
bioactive.free.invivo | If FALSE (default), then the total concentration is treatedas bioactive in vivo. If TRUE, the the unbound (free) plasma concentration is treated as bioactive in vivo. Only works with tissue = NULL in current implementation. |
Caco2.options | A list of options to use when working with Caco2 apical tobasolateral data |
... | Additional parameters passed to parameterize function if parameters is NULL. |
Details
This equation is a simplification of the steady-state plasma concentrationin the three-comprtment model (seesolve_3comp), neglecting ahigher order term that causes this Css to be higher for very rapidly clearedchemicals.
Value
Steady state plasma concentration in mg/L units
Author(s)
Robert Pearce and John Wambaugh
References
Rotroff DM, Wetmore BA, Dix DJ, Ferguson SS, Clewell HJ, Houck KA, LeCluyse EL, Andersen ME, Judson RS, Smith CM, others (2010).“Incorporating human dosimetry and exposure into high-throughput in vitro toxicity screening.”Toxicological Sciences,117(2), 348–358.doi:10.1093/toxsci/kfq220.
Wetmore BA, Wambaugh JF, Ferguson SS, Sochaski MA, Rotroff DM, Freeman K, Clewell III HJ, Dix DJ, Andersen ME, Houck KA, others (2012).“Integration of dosimetry, exposure, and high-throughput screening data in chemical toxicity assessment.”Toxicological Sciences,125(1), 157–174.doi:10.1093/toxsci/kfr254.
See Also
Calculate the analytic steady state plasma concentration for model pbtk.
Description
This function calculates the analytic steady state concentration (mg/L) as a resultof constant oral infusion dosing. Concentrations are returned for plasma by default, but varioustissues or blood concentrations can also be given as specified.
Usage
calc_analytic_css_pbtk( chem.name = NULL, chem.cas = NULL, dtxsid = NULL, species = "Human", parameters = NULL, dosing = list(daily.dose = 1), hourly.dose = NULL, dose.units = "mg", concentration = "plasma", suppress.messages = FALSE, recalc.blood2plasma = FALSE, tissue = NULL, restrictive.clearance = TRUE, bioactive.free.invivo = FALSE, Caco2.options = list(), ...)Arguments
chem.name | Either the chemical name, CAS number, or the parameters must be specified. |
chem.cas | Either the chemical name, CAS number, or the parameters must be specified. |
dtxsid | EPA's 'DSSTox Structure ID (https://comptox.epa.gov/dashboard)the chemical must be identified by either CAS, name, or DTXSIDs |
species | Species desired (either "Rat", "Rabbit", "Dog", "Mouse", ordefault "Human"). |
parameters | Chemical parameters from parameterize_pbtk (for model = 'pbtk'), parameterize_3comp (for model = '3compartment), parameterize_1comp(for model = '1compartment') or parameterize_steadystate (for model = '3compartmentss'), overrides chem.name and chem.cas. |
dosing | List of dosing metrics used in simulation, which includesthe namesake entries of a model's associated dosing.params. For steady-statecalculations this is likely to be either "daily.dose" for oral exposures or"Cinhaled" for inhalation. |
hourly.dose | Hourly dose rate mg/kg BW/h. |
dose.units | The units associated with the dose received. |
concentration | Desired concentration type, 'blood', 'tissue', or default 'plasma'. |
suppress.messages | Whether or not the output message is suppressed. |
recalc.blood2plasma | Recalculates the ratio of the amount of chemical in the blood to plasma using the input parameters. Use this if you have altered hematocrit, Funbound.plasma, or Krbc2pu. |
tissue | Desired tissue conentration (defaults to whole body concentration.) |
restrictive.clearance | If TRUE (default), then only the fraction ofchemical not bound to protein is available for metabolism in the liver. If FALSE, then all chemical in the liver is metabolized (faster metabolism dueto rapid off-binding). |
bioactive.free.invivo | If FALSE (default), then the total concentration is treatedas bioactive in vivo. If TRUE, the the unbound (free) plasma concentration is treated as bioactive in vivo. Only works with tissue = NULL in current implementation. |
Caco2.options | A list of options to use when working with Caco2 apical tobasolateral data |
... | Additional parameters passed to parameterize function if parameters is NULL. |
Details
The PBTK model (Pearce et al. 2017) predicts the amount of chemical invarious tissues of the body. A system of ordinarydifferential equations describes how the amounts in each tissue change as a function of time. The analytic steady-state equation was found by algebraically solving for the tissue concentrations that result in eachequation being zero – thus determining the concentration at which there is no changeover time as the result of a fixed infusion dose rate.
The analytical solution is:
C^{ss}_{ven} = \frac{dose rate * \frac{Q_{liver} + Q_{gut}}{\frac{f_{up}}{R_{b:p}}*Cl_{metabolism} + (Q_{liver}+Q_{gut})}}{Q_{cardiac} - \frac{(Q_{liver} + Q_{gut})^2}{\frac{f_{up}}{R_{b:p}}*Cl_{metabolism} + (Q_{liver}+Q_{gut})} - \frac{(Q_{kidney})^2}{\frac{f_{up}}{R_{b:p}}*Q_{GFR}+Q_{kideny}}-Q_{rest}}
C^{ss}_{plasma} = \frac{C^{ss}_{ven}}{R_{b:p}}
C^{ss}_{tissue} = \frac{K_{tissue:fuplasma}*f_{up}}{R_{b:p}}*C^{ss}_{ven}
where Q_cardiac is the cardiac output, Q_gfr is the glomerular filtrationrate in the kidney, other Q's indicate blood flows to various tissues, Cl_metabolism is the chemical-specific whole liver metabolism clearance,f_up is the chemical-specific fraction unbound in plasma, R_b2p is the chemical specific ratio of concentrations in blood:plasma, K_tissue2fuplasmais the chemical- and tissue-specific equilibrium partition coefficientand dose rate has units of mg/kg/day.
Value
Steady state plasma concentration in mg/L units
Author(s)
Robert Pearce and John Wambaugh
References
Pearce RG, Setzer RW, Strope CL, Wambaugh JF, Sipes NS (2017).“Httk: R package for high-throughput toxicokinetics.”Journal of Statistical Software,79(4), 1.doi:10.18637/jss.v079.i04.
See Also
Calculate the steady state concentration for the sum of clearancessteady-state model with exhalation
Description
This function calculates the analytic steady state plasma or venous blood concentrations as a result of infusion dosing.
Usage
calc_analytic_css_sumclearances( chem.name = NULL, chem.cas = NULL, dtxsid = NULL, species = "Human", parameters = NULL, dosing = list(daily.dose = 1), hourly.dose = NULL, dose.units = "mg", concentration = "plasma", Caco2.options = NULL, suppress.messages = FALSE, recalc.blood2plasma = FALSE, tissue = NULL, route = "oral", restrictive.clearance = TRUE, bioactive.free.invivo = FALSE, ...)Arguments
chem.name | Either the chemical name, CAS number, or the parameters must be specified. |
chem.cas | Either the chemical name, CAS number, or the parameters must be specified. |
dtxsid | EPA's 'DSSTox Structure ID (https://comptox.epa.gov/dashboard)the chemical must be identified by either CAS, name, or DTXSIDs |
species | Species desired (either "Rat", "Rabbit", "Dog", "Mouse", ordefault "Human"). |
parameters | Chemical parameters from |
dosing | List of dosing metrics used in simulation, which includesthe namesake entries of a model's associated dosing.params. For steady-statecalculations this is likely to be either "daily.dose" for oral exposures or"Cinhaled" for inhalation. |
hourly.dose | Hourly dose rate mg/kg BW/h. |
dose.units | The units associated with the dose received. |
concentration | Desired concentration type, 'blood' or default 'plasma'. |
Caco2.options | A list of options to use when working with Caco2 apical tobasolateral data |
suppress.messages | Whether or not the output message is suppressed. |
recalc.blood2plasma | Recalculates the ratio of the amount of chemical in the blood to plasma using the input parameters. Use this if you have 'altered hematocrit, Funbound.plasma, or Krbc2pu. |
tissue | Desired tissue concentration (defaults to whole body concentration.) |
route | Route of exposure ("inhalation" or [DEFAULT] "oral"). |
restrictive.clearance | If TRUE (default), then only the fraction ofchemical not bound to protein is available for metabolism in the liver. If FALSE, then all chemical in the liver is metabolized (faster metabolism dueto rapid off-binding). |
bioactive.free.invivo | If FALSE (default), then the total concentration is treatedas bioactive in vivo. If TRUE, the the unbound (free) plasma concentration is treated as bioactive in vivo. Only works with tissue = NULL in current implementation. |
... | Additional parameters passed to parameterize function if parameters is NULL. |
Value
Steady state plasma concentration in mg/L units
Author(s)
John Wambaugh
See Also
Calculate the fractional contributions to total clearance
Description
Steady-state clearance is a function of multiple processes. For example,meabolism in the liver and glomerular filtration in the kidney. This functiontakes a list of parameters potentially impacting total clearance anditeratively sets all but one of the paramters to zero. This allowscalculation of the fration of total clearance driven by that parameter.
Usage
calc_clearance_frac( fraction.params = c("Clint", "Qgfrc"), chem.cas = NULL, chem.name = NULL, dtxsid = NULL, parameters = NULL, species = "human", default.to.human = FALSE, suppress.messages = FALSE, model = "3compartmentss", restrictive.clearance = TRUE, parameterize.args = list(), analytic_css.args = list())Arguments
fraction.params | A vector of character strings identifying theparameters whose fractional contributions are to be calculated. Defaults to'Qfgr' and 'Qtotal.liverc'. |
chem.cas | Chemical Abstract Services Registry Number (CAS-RN) – ifparameters is not specified then the chemical must be identified by eitherCAS, name, or DTXISD |
chem.name | Chemical name (spaces and capitalization ignored) – ifparameters is not specified then the chemical must be identified by eitherCAS, name, or DTXISD |
dtxsid | EPA's 'DSSTox Structure ID (https://comptox.epa.gov/dashboard)– if parameters is not specified then the chemical must be identified by either CAS, name, or DTXSIDs |
parameters | Parameters from the appropriate parameterization functionfor the model indicated by argument model |
species | Species desired (either "Rat", "Rabbit", "Dog", "Mouse", ordefault "Human"). |
default.to.human | (Logical) Substitutes missing rat values withhuman values if TRUE. (Not applicable for 'calc_fabs.oral'.)(Defaults to 'FALSE'.) |
suppress.messages | Whether or not the output message is suppressed. |
model | Model used in calculation, for example'pbtk' for the multiple compartmentmodel,'3compartment' for the three compartment model, and '1compartment' forthe one compartment model. Defaults to '3compartmentss'. |
restrictive.clearance | Protein binding not taken into account (set to 1)in liver clearance if FALSE. |
parameterize.args | Named list of any additional arguments passed tomodel parameterization function (other than the already-named arguments).Default 'list()' to pass no additional arguments. |
analytic_css.args | Arguments to analytical Css function |
Value
A numeric fraction unpbound in plasma between zero and one
Author(s)
John Wambaugh
Examples
# 3compartmentss model:calc_clearance_frac(chem.name="bisphenola")# pbtk model:calc_clearance_frac(chem.name="bisphenola", model="pbtk", fraction.params=c("Qgfrc","Clmetabolismc"))# A model with exhalation:# sumclearances model:calc_clearance_frac(chem.name="bisphenola", model="sumclearances", fraction.params=c("Clint","Qgfrc","Qalvc"))calc_clearance_frac(chem.name="toluene", model="sumclearances", fraction.params=c("Clint","Qgfrc","Qalvc")) # 3comp2 model:calc_clearance_frac(chem.name="toluene", model="3compartment2", fraction.params=c("Clmetabolismc","Qgfrc","Qalvc"))Find the steady state concentration and the day it is reached.
Description
This function finds the day a chemical comes within the specifiedrange of the analytical steady state venous blood or plasmaconcentration(from calc_analytic_css) for the multiple compartment, threecompartment, and one compartment models, the fraction of the true steadystate value reached on that day, the maximum concentration, and the averageconcentration at the end of the simulation.
Usage
calc_css( chem.name = NULL, chem.cas = NULL, dtxsid = NULL, parameters = NULL, species = "Human", f = 0.01, daily.dose = 1, doses.per.day = 3, dose.units = "mg/kg", route = "oral", days = 21, output.units = "uM", suppress.messages = FALSE, tissue = NULL, model = "pbtk", f.change = 1e-05, dosing = NULL, parameterize.args.list = list(), ...)Arguments
chem.name | Either the chemical name, CAS number, or parameters must bespecified. |
chem.cas | Either the chemical name, CAS number, or parameters must bespecified. |
dtxsid | EPA's DSSTox Structure ID(https://comptox.epa.gov/dashboard) the chemical must be identified byeither CAS, name, or DTXSIDs |
parameters | Chemical parameters from parameterize_pbtk function,overrides chem.name and chem.cas. |
species | Species desired (either "Rat", "Rabbit", "Dog", "Mouse", ordefault "Human"). |
f | Fractional distance from the final steady state concentration thatthe average concentration must come within to be considered at steady state. |
daily.dose | Total daily dose, mg/kg BW. |
doses.per.day | Number of oral doses per day. |
dose.units | The units associated with the dose received. |
route | Route of exposure (either "oral", "iv", or "inhalation" default"oral"). |
days | Initial number of days to run simulation that is multiplied oneach iteration. |
output.units | Units for returned concentrations, defaults to uM (specifyunits = "uM") but can also be mg/L. |
suppress.messages | Whether or not to suppress messages. |
tissue | Desired tissue concentration (default value is NULL, will dependon model – see |
model | Model used in calculation, 'pbtk' for the multiple compartmentmodel,'3compartment' for the three compartment model, and '1compartment' forthe one compartment model. |
f.change | Fractional change of daily steady state concentration reachedto stop calculating. |
dosing | The dosing object for more complicated scenarios. Defaults torepeated |
parameterize.args.list | Named list of any additional arguments passed tomodel parameterization function (other than the already-named arguments).Default 'list()' to pass no additional arguments. |
... | Additional arguments passed to |
Value
frac | Ratio of the mean concentration on the day steady state isreached (based on doses.per.day) to the analytical Css (based on infusiondosing). |
max | The maximum concentration of the simulation. |
avg | The average concentration on the final day of the simulation. |
the.day | The day the average concentration comes within 100 * ppercent of the true steady state concentration. |
Author(s)
Robert Pearce, John Wambaugh
See Also
Examples
calc_css(chem.name='Bisphenol-A',doses.per.day=5,f=.001,output.units='mg/L')parms <- parameterize_3comp(chem.name='Bisphenol-A')parms$Funbound.plasma <- .07calc_css(chem.name='Bisphenol-A',parameters=parms,model='3compartment')out <- solve_pbtk(chem.name = "Bisphenol A", days = 50, daily.dose=1, doses.per.day = 3)plot.data <- as.data.frame(out)css <- calc_analytic_css(chem.name = "Bisphenol A")library("ggplot2")c.vs.t <- ggplot(plot.data,aes(time, Cplasma)) + geom_line() +geom_hline(yintercept = css) + ylab("Plasma Concentration (uM)") +xlab("Day") + theme(axis.text = element_text(size = 16), axis.title =element_text(size = 16), plot.title = element_text(size = 17)) +ggtitle("Bisphenol A")print(c.vs.t)calc_css(chem.name='nicotine', model="1compartment")calc_css(chem.name='nicotine', model="3compartment")calc_css(chem.name="endrin")Calculate Dermal Equivalent Dose
Description
This functions converts a steady state plasma concetration for a givendermal exposure scenario to an equivalent steady state media concentrationfor a single dose.
Usage
calc_dermal_equiv( conc, chem.name = NULL, chem.cas = NULL, dtxsid = NULL, parameters = NULL, days = 20, doses.per.day = 3, skin_depth = 0.3, skin.pH = 7, Vmedia = 0.001, Fskinexposed = 0.1, ...)Arguments
conc | Bioactive in vitro concentration, arbitrary units. |
chem.name | Either the chemical name or the CAS number must bespecified. |
chem.cas | Either the CAS number or the chemical name must bespecified. |
dtxsid | EPA's DSSTox Structure ID (https://comptox.epa.gov/dashboard)the chemical must be identified by either CAS, name, or DTXSIDs |
parameters | Parameters from parameterize_dermal_pbtk. |
days | Number of days of simulation. |
doses.per.day | Number of doses per day. |
skin_depth | Skin depth, cm. |
skin.pH | pH of skin/dermis. |
Vmedia | Volume of media, L, used when parameters are not given. |
Fskinexposed | Fraction of total skin exposed, used when parameters arenot given. |
... | Additional parameters passed to solve_dermal_pbtk. |
Details
Returned dose is dependent on doses.per.day.
Value
Equivalent dose in specified units, default of mg/kg BW/day.
Author(s)
Annabel Meade
Calculate the distribution coefficient
Description
This function estimates the ratio of the equilibrium concentrations ofa compound in octanol and water, taking into account the charge of thecompound. Given the pH, we assume the neutral (uncharged) fraction ofcompound partitions according to the hydrophobicity (Pow). We assume thatonly a fraction alpha (defaults to 0.001 – Schmitt (2008)) of the chargedcompound partitions into lipid (octanol):Dow = Pow*(Fneutral + alpha*Fcharged)Fractions charged are calculatedaccording to hydrogen ionization equilibria (pKa_Donor, pKa_Accept) usingcalc_ionization.
Usage
calc_dow( Pow = NULL, chem.cas = NULL, chem.name = NULL, dtxsid = NULL, parameters = NULL, pH = NULL, pKa_Donor = NULL, pKa_Accept = NULL, fraction_charged = NULL, alpha = 0.001)Arguments
Pow | Octanol:water partition coefficient (ratio of concentrations) |
chem.cas | Either the chemical name or the CAS number must bespecified. |
chem.name | Either the chemical name or the CAS number must bespecified. |
dtxsid | EPA's 'DSSTox Structure ID (https://comptox.epa.gov/dashboard)the chemical must be identified by either CAS, name, or DTXSIDs |
parameters | Chemical parameters from a parameterize_MODEL function,overrides chem.name and chem.cas. |
pH | pH where ionization is evaluated. |
pKa_Donor | Compound H dissociation equilibirum constant(s).Overwrites chem.name and chem.cas. |
pKa_Accept | Compound H association equilibirum constant(s).Overwrites chem.name and chem.cas. |
fraction_charged | Fraction of chemical charged at the given pH |
alpha | Ratio of Distribution coefficient D of totally charged species and that of the neutral form |
Value
Distribution coefficient (numeric)
Author(s)
Robert Pearce and John Wambaugh
References
Schmitt W (2008).“General approach for the calculation of tissue to plasma partition coefficients.”Toxicology in vitro,22(2), 457–467.doi:10.1016/j.tiv.2007.09.010.
Pearce RG, Setzer RW, Davis JL, Wambaugh JF (2017).“Evaluation and calibration of high-throughput predictions of chemical distribution to tissues.”Journal of pharmacokinetics and pharmacodynamics,44, 549–565.doi:10.1007/s10928-017-9548-7.
Strope CL, Mansouri K, Clewell III HJ, Rabinowitz JR, Stevens C, Wambaugh JF (2018).“High-throughput in-silico prediction of ionization equilibria for pharmacokinetic modeling.”Science of The Total Environment,615, 150–160.doi:10.1016/j.scitotenv.2017.09.033.
See Also
Calculate the elimination rate for a one compartment model
Description
This function calculates an elimination rate from the three compartmentsteady state model where elimination is entirely due to metablism by theliver and glomerular filtration in the kidneys.
Usage
calc_elimination_rate( chem.cas = NULL, chem.name = NULL, dtxsid = NULL, parameters = NULL, species = "Human", model = "3compartmentss", suppress.messages = TRUE, ...)Arguments
chem.cas | Either the cas number or the chemical name must bespecified. |
chem.name | Either the chemical name or the cas number must bespecified. |
dtxsid | EPA's 'DSSTox Structure ID (https://comptox.epa.gov/dashboard)the chemical must be identified by either CAS, name, or DTXSIDs |
parameters | Chemical parameters from parameterize_steadystate or1compartment function, overrides chem.name and chem.cas. |
species | Species desired (either "Rat", "Rabbit", "Dog", "Mouse", ordefault "Human"). |
model | The model used to calculate total clearance (defaults to "3compartmentss") |
suppress.messages | Whether or not the output message is suppressed. |
... | Additional parameters passed to parameterize function if parameters is NULL. |
Details
Elimination rate calculated by dividing the total clearance (using thedefault -stirred hepatic model) by the volume of distribution. Whenspecies is specified as rabbit, dog, or mouse, the function uses theappropriate physiological data(volumes and flows) but substitues humanfraction unbound, partition coefficients, and intrinsic hepatic clearance.
Value
Elimination rate | Units of 1/h. |
Author(s)
John Wambaugh
References
Schmitt W (2008).“General approach for the calculation of tissue to plasma partition coefficients.”Toxicology in vitro,22(2), 457–467.doi:10.1016/j.tiv.2007.09.010.
Dawson DE, Ingle BL, Phillips KA, Nichols JW, Wambaugh JF, Tornero-Velez R (2021).“Designing QSARs for Parameters of High-Throughput Toxicokinetic Models Using Open-Source Descriptors.”Environmental Science & Technology,55(9), 6505-6517.doi:10.1021/acs.est.0c06117.PMID: 33856768, https://doi.org/10.1021/acs.est.0c06117.
Kilford PJ, Gertz M, Houston JB, Galetin A (2008).“Hepatocellular binding of drugs: correction for unbound fraction in hepatocyte incubations using microsomal binding or drug lipophilicity data.”Drug Metabolism and Disposition,36(7), 1194–1197.doi:10.1124/dmd.108.020834.
See Also
calc_total_clearance for calculation of total clearance
calc_vdist for calculation of volume of distribution
Examples
calc_elimination_rate(chem.name="Bisphenol A")## Not run: calc_elimination_rate(chem.name="Bisphenol A",species="Rat")# non-restrictive clearance should be faster:kelim1 <- calc_elimination_rate(chem.cas="80-05-7")kelim2 <- calc_elimination_rate(chem.cas="80-05-7", restrictive.clearance=FALSE)if (!(kelim2 > kelim1)) stop("kelim2 is not faster than kelim1")## End(Not run)Functions for calculating the bioavaialble fractions from oral doses
Description
These functions calculate the fraction of chemical absorbed from the gutbased upon in vitro measured Caco-2 membrane permeability data.Caco-2 permeabilities (10^{-6} cm/s) are related to effective permeability based on Yang et al. (2007).These functions calculate the fraction absorbed (calc_fabs.oral – S Darwich et al. (2010) andYu and Amidon (1999)), the fractionsurviving first pass gut metabolism (calc_fgut.oral), and the overall systemicoral bioavailability(calc_fbio.oral). Note that the first pass hepatic clearance is calculated within theparameterization and other functions. usingcalc_hep_bioavailability Absorption rate is calculated according to Fick's law (LennernÄs (1997)) assuming low blood concentrations.
Usage
calc_fbio.oral( parameters = NULL, chem.cas = NULL, chem.name = NULL, dtxsid = NULL, species = "Human", suppress.messages = FALSE, ...)calc_fabs.oral( parameters = NULL, chem.cas = NULL, chem.name = NULL, dtxsid = NULL, species = "Human", suppress.messages = FALSE, Caco2.Pab.default = 1.6)calc_peff( parameters = NULL, chem.cas = NULL, chem.name = NULL, dtxsid = NULL, species = "Human", suppress.messages = FALSE, Caco2.Pab = NULL, parameterize.args.list = list())calc_kgutabs( parameters = NULL, chem.cas = NULL, chem.name = NULL, dtxsid = NULL, species = "Human", suppress.messages = FALSE, parameterize.args.list = list())calc_fgut.oral( parameters = NULL, chem.cas = NULL, chem.name = NULL, dtxsid = NULL, species = "Human", suppress.messages = FALSE, Caco2.Pab.default = 1.6, parameterize.args.list = list())Arguments
parameters | (List) A list of the parameters (Caco2.Pab, Funbound.Plasma, Rblood2plasma,Clint, BW, Qsmallintestine, Fabs, Fgut) used in the calculation, either supplied by useror calculated in |
chem.cas | (Character) Chemical CAS number. (Defaults to 'NULL'.)(Note: Either the chemical name, CAS number, or EPA's DSSTox Structure IDmust be specified). |
chem.name | (Character) Chemical name. (Defaults to 'NULL'.)(Note: Either the chemical name, CAS number, or EPA's DSSTox Structure IDmust be specified). |
dtxsid | (Character) EPA's DSSTox Structure ID(https://comptox.epa.gov/dashboard). (Defaults to 'NULL'.)(Note: Either the chemical name, CAS number, or EPA's DSSTox Structure IDmust be specified). |
species | (Character) Species desired (either "Rat", "Rabbit", "Dog","Mouse", or default "Human"). |
suppress.messages | (Logical) Whether or not the output message issuppressed. (Defaults to 'FALSE'.) |
... | Additional parameters passed to parameterize function if parameters is NULL. |
Caco2.Pab.default | (Numeric) Caco2 apical to basolateral data.(Defaults to 1.6.) (Not applicable for 'calc_fbio.oral'.) |
Caco2.Pab | (Numeric) Caco2 apical to basolaterial permeability used by calc_peff |
parameterize.args.list | List of arguments passed to |
Details
We assume that systemic oral bioavailability (F_{bio})consists of three components: (1) the fraction of chemical absorbed from intestinal lumen into enterocytes (F_{abs}), (2) the fraction surviving intestinal metabolism (F_{gut}), and (3) the fraction surviving first-pass hepatic metabolism (F_{hep}). This function returns (F_{abs}*F_{gut}).
We model systemic oral bioavailability asF_{bio}=F_{abs}*F_{gut}*F_{hep}.F_{hep} is estimated from in vitro TK data usingcalc_hep_bioavailability.IfF_{bio} has been measured in vivo and is found intablechem.physical_and_invitro.data then we setF_{abs}*F_{gut} to the measured value divided byF_{hep}.Otherwise, if Caco2 membrane permeability data or predictionsare availableF_{abs} is estimated usingcalc_fgut.oral.Intrinsic hepatic metabolism is used to very roughly estimate (F_{gut})usingcalc_fgut.oral.If argument keepit100 is used then there is complete absorption from the gut(that is,F_{abs}=F_{gut}=1).
Value
fbio.oral | Oral bioavailability, the fraction of oral dose reaching systemic distribution in the body. |
fabs.oral | Fraction of dose absorbed, i.e. the fraction of the dosethat enters the gutlumen. |
fgut.oral | Fraction of chemical survivingfirst pass metabolism in the gut. |
fhep.oral | Fraction of chemicalsurviving first pass hepatic clearance. |
kgutabs | Rate of absorption from gut (1/h). |
Functions
calc_fabs.oral(): Calculate the fraction absorbed in the gut (Darwich et al., 2010)calc_peff(): Calculate the effective gut permeability rate (10^-4 cm/s)calc_kgutabs(): Calculate the gut absorption rate (1/h)calc_fgut.oral(): Calculate the fraction of chemical surviving first pass metabolism in the gut
Author(s)
Gregory Honda and John Wambaugh
References
S Darwich A, Neuhoff S, Jamei M, Rostami-Hodjegan A (2010).“Interplay of metabolism and transport in determining oral drug absorption and gut wall metabolism: a simulation assessment using the 'Advanced Dissolution, Absorption, Metabolism (ADAM)' model.”Current drug metabolism,11(9), 716–729.doi:10.2174/138920010794328913.
Yang J, Jamei M, Yeo KR, Tucker GT, Rostami-Hodjegan A (2007).“Prediction of intestinal first-pass drug metabolism.”Current drug metabolism,8(7), 676–684.doi:10.2174/138920007782109733.
Honda GS, Kenyon EM, Davidson-Fritz S, Dinallo R, El Masri H, Korol-Bexell E, Li L, Angus D, Pearce RG, Sayre RR, others (2025).“Impact of gut permeability on estimation of oral bioavailability for chemicals in commerce and the environment.”ALTEX-Alternatives to animal experimentation,42(1), 56–74.doi:10.14573/altex.2403271.
Yu LX, Amidon GL (1999).“A compartmental absorption and transit model for estimating oral drug absorption.”International journal of pharmaceutics,186(2), 119–125.doi:10.1016/S0378-5173(99)00147-7.
LennernÄs H (1997).“Human jejunal effective permeability and its correlation with preclinical drug absorption models.”Journal of Pharmacy and Pharmacology,49(7), 627–638.doi:10.1111/j.2042-7158.1997.tb06084.x.
Calculate maternal-fetal physiological parameters
Description
This function uses the equations from Kapraun (2019) to calculate chemical-independent physiological paramreters as a function of gestational age in weeks.
Usage
calc_fetal_phys(week = 12, ...)Arguments
week | Gestational week |
... | Additional arguments to parameterize_fetal_pbtk |
Details
BW = pre_pregnant_BW + BW_cubic_theta1 * tw + BW_cubic_theta2 * tw^2 + BW_cubic_theta3 * tw^3
Wadipose = Wadipose_linear_theta0 + Wadipose_linear_theta1 * tw ;
Wfkidney = 0.001 * Wfkidney_gompertz_theta0 * exp ( Wfkidney_gompertz_theta1 / Wfkidney_gompertz_theta2 * ( 1 - exp ( - Wfkidney_gompertz_theta2 * tw ) ) ) ;
Wfthyroid = 0.001 * Wfthyroid_gompertz_theta0 * exp ( Wfthyroid_gompertz_theta1 / Wfthyroid_gompertz_theta2 * ( 1 - exp ( - Wfthyroid_gompertz_theta2 * tw ) ) ) ;
Wfliver = 0.001 * Wfliver_gompertz_theta0 * exp ( Wfliver_gompertz_theta1 / Wfliver_gompertz_theta2 * ( 1 - exp ( - Wfliver_gompertz_theta2 * tw ) ) ) ;
Wfbrain = 0.001 * Wfbrain_gompertz_theta0 * exp ( Wfbrain_gompertz_theta1 / Wfbrain_gompertz_theta2 * ( 1 - exp ( - Wfbrain_gompertz_theta2 * tw ) ) ) ;
Wfgut = 0.001 * Wfgut_gompertz_theta0 * exp ( Wfgut_gompertz_theta1 / Wfgut_gompertz_theta2 * ( 1 - exp ( - Wfgut_gompertz_theta2 * tw ) ) ) ;
Wflung = 0.001 * Wflung_gompertz_theta0 * exp ( Wflung_gompertz_theta1 / Wflung_gompertz_theta2 * ( 1 - exp ( - Wflung_gompertz_theta2 * tw ) ) ) ;
hematocrit = ( hematocrit_quadratic_theta0 + hematocrit_quadratic_theta1 * tw + hematocrit_quadratic_theta2 * pow ( tw , 2 ) ) / 100 ;
Rblood2plasma = 1 - hematocrit + hematocrit * Krbc2pu * Fraction_unbound_plasma ;
fhematocrit = ( fhematocrit_cubic_theta1 * tw + fhematocrit_cubic_theta2 * pow ( tw , 2 ) + fhematocrit_cubic_theta3 * pow ( tw , 3 ) ) / 100 ;
Rfblood2plasma = 1 - fhematocrit + fhematocrit * Kfrbc2pu * Fraction_unbound_plasma_fetus ;
fBW = 0.001 * fBW_gompertz_theta0 * exp ( fBW_gompertz_theta1 / fBW_gompertz_theta2 * ( 1 - exp ( - fBW_gompertz_theta2 * tw ) ) ) ;
Vplacenta = 0.001 * ( Vplacenta_cubic_theta1 * tw + Vplacenta_cubic_theta2 * pow ( tw , 2 ) + Vplacenta_cubic_theta3 * pow ( tw , 3 ) ) ;
Vamnf = 0.001 * Vamnf_logistic_theta0 / ( 1 + exp ( - Vamnf_logistic_theta1 * ( tw - Vamnf_logistic_theta2 ) ) ) ;
Vplasma = Vplasma_mod_logistic_theta0 / ( 1 + exp ( - Vplasma_mod_logistic_theta1 * ( tw - Vplasma_mod_logistic_theta2 ) ) ) + Vplasma_mod_logistic_theta3 ;
Vrbcs = hematocrit / ( 1 - hematocrit ) * Vplasma ;
Vven = venous_blood_fraction * ( Vrbcs + Vplasma ) ;
Vart = arterial_blood_fraction * ( Vrbcs + Vplasma ) ;
Vadipose = 1 / adipose_density * Wadipose ;
Vffmx = 1 / ffmx_density * ( BW - Wadipose - ( fBW + placenta_density * Vplacenta + amnf_density * Vamnf ) ) ;
Vallx = Vart + Vven + Vthyroid + Vkidney + Vgut + Vliver + Vlung ;
Vrest = Vffmx - Vallx ;
Vfart = 0.001 * arterial_blood_fraction * fblood_weight_ratio * fBW ;
Vfven = 0.001 * venous_blood_fraction * fblood_weight_ratio * fBW ;
Vfkidney = 1 / kidney_density * Wfkidney ;
Vfthyroid = 1 / thyroid_density * Wfthyroid ;
Vfliver = 1 / liver_density * Wfliver ;
Vfbrain = 1 / brain_density * Wfbrain ;
Vfgut = 1 / gut_density * Wfgut ;
Vflung = 1 / lung_density * Wflung ;
Vfrest = fBW - ( Vfart + Vfven + Vfbrain + Vfkidney + Vfthyroid + Vfliver + Vfgut + Vflung ) ;
Qcardiac = 24 * ( Qcardiac_cubic_theta0 + Qcardiac_cubic_theta1 * tw + Qcardiac_cubic_theta2 * pow ( tw , 2 ) + Qcardiac_cubic_theta3 * pow ( tw , 3 ) ) ;
Qgut = 0.01 * ( Qgut_percent_initial + ( Qgut_percent_terminal - Qgut_percent_initial ) / term * tw ) * Qcardiac ;
Qkidney = 24 * ( Qkidney_cubic_theta0 + Qkidney_cubic_theta1 * tw + Qkidney_cubic_theta2 * pow ( tw , 2 ) + Qkidney_cubic_theta3 * pow ( tw , 3 ) ) ;
Qliver = 0.01 * ( Qliver_percent_initial + ( Qliver_percent_terminal - Qliver_percent_initial ) / term * tw ) * Qcardiac ;
Qthyroid = 0.01 * ( Qthyroid_percent_initial + ( Qthyroid_percent_terminal - Qthyroid_percent_terminal ) / term * tw ) * Qcardiac ;
Qplacenta = 24 * Qplacenta_linear_theta1 * 1000 * Vplacenta ;
Qadipose = 0.01 * ( Qadipose_percent_initial + ( Qadipose_percent_terminal - Qadipose_percent_initial ) / term * tw ) * Qcardiac ;
Qrest = Qcardiac - ( Qgut + Qkidney + Qliver + Qthyroid + Qplacenta + Qadipose ) ;
Qgfr = 60 * 24 * 0.001 * ( Qgfr_quadratic_theta0 + Qgfr_quadratic_theta1 * tw + Qgfr_quadratic_theta2 * pow ( tw , 2 ) ) ;
Qfrvtl = 60 * 24 * 0.001 * Qfrvtl_logistic_theta0 / ( 1 + exp ( - Qfrvtl_logistic_theta1 * ( tw - Qfrvtl_logistic_theta2 ) ) ) ;
Qflvtl = 60 * 24 * 0.001 * Qflvtl_logistic_theta0 / ( 1 + exp ( - Qflvtl_logistic_theta1 * ( tw - Qflvtl_logistic_theta2 ) ) ) ;
Qfda = 60 * 24 * 0.001 * Qfda_logistic_theta0 / ( 1 + exp ( - Qfda_logistic_theta1 * ( tw - Qfda_logistic_theta2 ) ) ) ;
Qfartb = Qflvtl + Qfda ;
Qfcardiac = Qfartb ;
Qflung = Qfrvtl - Qfda ;
Qfplacenta = 60 * 24 * 0.001 * Qfplacenta_logistic_theta0 / ( 1 + exp ( - Qfplacenta_logistic_theta1 * ( tw - Qfplacenta_logistic_theta2 ) ) ) ;
Qfdv = 60 * 24 * 0.001 * Qfdv_gompertz_theta0 * exp ( Qfdv_gompertz_theta1 / Qfdv_gompertz_theta2 * ( 1 - exp ( - Qfdv_gompertz_theta2 * tw ) ) ) ;
Qfgut = Qfgut_percent / Qfnonplacental_percent * ( 1 - Qfplacenta / Qfartb ) * Qfartb ;
Qfkidney = Qfkidney_percent / Qfnonplacental_percent * ( 1 - Qfplacenta / Qfartb ) * Qfartb ;
Qfbrain = Qfbrain_percent / Qfnonplacental_percent * ( 1 - Qfplacenta / Qfartb ) * Qfartb ;
Qfliver = Qfliver_percent / ( 100 - ( Qbrain_percent + Qkidney_percent + Qgut_percent ) ) * ( 1 - ( Qfbrain_percent +Qfkidney_percent + Qfgut_percent ) / Qfnonplacental_percent ) * ( 1 - Qfplacenta / Qfartb ) * Qfartb ;
Qfthyroid = Qfthyroid_percent / ( 100 - ( Qbrain_percent + Qkidney_percent + Qgut_percent ) ) * ( 1 - ( Qfbrain_percent +Qfkidney_percent + Qfgut_percent ) / Qfnonplacental_percent ) * ( 1 - Qfplacenta / Qfartb ) * Qfartb ;
Qfrest = Qfcardiac - ( Qfplacenta + Qfgut + Qfliver + Qfthyroid + Qfkidney + Qfbrain ) ;
Qfbypass = Qfcardiac - Qflung ;
Value
list containing:
BW | Maternal body weight, kg |
Wadipose | Maternal adipose fraction of total weight |
Wfkidney | Fetal kidney fraction of total weight |
Wfthyroid | Fetal thyroid fraction of total weight |
Wfliver | Fetal liver fraction of total weight |
Wfbrain | Fetal brain fraction of total weight |
Wfgut | Fetal gut fraction of total weight |
Wflung | Fetal lung fraction of total weight |
hematocrit | Maternal hematocrit fraction of blood |
Rblood2plasma | Maternal Rblood2plasma |
fhematocrit | Fetal hematocrit fraction of blood |
Rfblood2plasma | Fetal Rfblood2plasma |
fBW | Fetal body weight, kg |
Vplacenta | Volume of Vplacenta, L |
Vamnf | Volume of amniotic fluid, L |
Vplasma | Maternal volume of plasma, L |
Vrbcs | Maternal volume of red blood cells, L |
Vven | Maternal volume of venous blood, L |
Vart | Maternal volume of arterial blood, L |
Vadipose | Maternal volume of adipose, L |
Vffmx | Fetal volume ofVffmx, L |
Vallx | Vallx, L |
Vrest | Maternal volume of rest of body, L |
Vfart | Fetal volume of arterial blood, L |
Vfven | Fetal volume of venous blood, L |
Vfkidney | Fetal volume of kidney, L |
Vfthyroid | Fetal volume of thyroid, L |
Vfliver | Fetal volume of liver, L |
Vfbrain | Fetal volume of brain, L |
Vfgut | Fetal volume of gut, L |
Vflung | Fetal volume of lung, L |
Vfrest | Fetal volume of rest of body, L |
Qcardiac | Maternal cardiac output blood flow, L/day |
Qgut | Maternal blood flow to gut, L/day |
Qkidney | Maternal blood flow to kidney, L/day |
Qliver | Maternal blood flow to liver, L/day |
Qthyroid | Maternal blood flow to thyroid, L/day |
Qplacenta | Maternal blood flow to placenta, L/day |
Qadipose | Maternal blood flow to adipose, L/day |
Qrest | Maternal blood flow to rest, L/day |
Qgfr | Maternal glomerular filtration rate in kidney, L/day |
Qfrvtl | Fetal blood flow to right ventricle, L/day |
Qflvtl | Fetal blood flow to left ventircle, L/day |
Qfda | Fetal blood flow to Qfda, L/day |
Qfartb | Fetal blood flow to Qfartb, L/day |
Qfcardiac | Fetal cardiac output blood flow, L/day |
Qflung | Fetal blood flow to lung, L/day |
Qfplacenta | Fetal blood flow to placenta, L/day |
Qfdv | Fetal blood flow to Qfdv, L/day |
Qfgut | Fetal blood flow to gut, L/day |
Qfkidney | Fetal blood flow to kidney, L/day |
Qfbrain | Fetal blood flow to brain, L/day |
Qfliver | Fetal blood flow to liver, L/day |
Qfthyroid | Fetal blood flow to thyroid, L/day |
Qfrest | Fetal blood flow to rest, L/day |
Qfbypass | Fetal blood flow to Qfbypass, L/day |
Author(s)
John Wambaugh
References
Kapraun DF, Wambaugh JF, Setzer RW, Judson RS (2019).“Empirical models for anatomical and physiological changes in a human mother and fetus during pregnancy and gestation.”PLOS ONE,14(5), 1-56.doi:10.1371/journal.pone.0215906.
Calculate the correction for lipid binding in plasma binding assay
Description
Poulin and Haddad (2012) observed "...that fora highly lipophilic compound, the calculated fup is byfar [less than] the experimental values observed underin vitro conditions." Pearce et al. (2017) hypothesized that there was additional lipidbinding in vivo that acted as a sink for lipophilic compounds, reducing theeffective fup in vivo. It is possible that this is due to the binding of lipophilic compounds on the nonplasma-side of the rapid equilibrium dialysis plates (Waters et al., 2008).Pearce et al. (2017) compared predicted and observed tissue partition coefficientsfor a range of compounds. They showed that predictions were improved by adding additional binding proportional to the distribution coefficient Dow (calc_dow)and the fractional volume of lipid inplasma (Flipid). We calculateFlipid as the sum of the physiological plasma neutral lipid fractional volume and 30 percent of the plasma neutral phospholipid fractional volume. We use valuesfrom Peyret et al. (2010) for rats and Poulin and Haddad (2012)for humans. The estimate of 30 percent of theneutral phospholipid volume as neutral lipid was used for simplictity's sake inplace of our membrane affinity predictor. To account for additional binding to lipid, plasma to water partitioning(Kplasma:water = 1/fup)is increased as such:Kcorrectedplasma:water = 1/fcorrectedup = 1/fin vitroup + Dow*Flipid
Usage
calc_fup_correction( fup = NULL, chem.cas = NULL, chem.name = NULL, dtxsid = NULL, parameters = NULL, Flipid = NULL, plasma.pH = 7.4, dow74 = NULL, species = "Human", default.to.human = FALSE, force.human.fup = FALSE, suppress.messages = FALSE)Arguments
fup | Fraction unbound in plasma, if provided this argument overidesvalues from argument parameters and |
chem.cas | Chemical Abstract Services Registry Number (CAS-RN) – ifparameters is not specified then the chemical must be identified by eitherCAS, name, or DTXISD |
chem.name | Chemical name (spaces and capitalization ignored) – ifparameters is not specified then the chemical must be identified by eitherCAS, name, or DTXISD |
dtxsid | EPA's 'DSSTox Structure ID (https://comptox.epa.gov/dashboard)– if parameters is not specified then the chemical must be identified by either CAS, name, or DTXSIDs |
parameters | Parameters from the appropriate parameterization functionfor the model indicated by argument model |
Flipid | The fractional volume of lipid in plasma (from |
plasma.pH | pH of plasma (default 7.4) |
dow74 | The octanol-water distribution ratio (DOW). |
species | Species desired (either "Rat", "Rabbit", "Dog", "Mouse", ordefault "Human"). |
default.to.human | Substitutes missing fraction of unbound plasma withhuman values if true. |
force.human.fup | Returns human fraction of unbound plasma incalculation for rats if true.When species is specified as rabbit, dog, or mouse, the human unboundfraction is substituted. |
suppress.messages | Whether or not the output message is suppressed. |
Details
Note that octanal:water partitioning above 1:1,000,000 (LogDow > 6)are truncated at 1:1,000,000 because greater partitioning wouldlikely take longer than protein binding assay itself.
Value
A numeric fraction unpbound in plasma between zero and one
Author(s)
John Wambaugh
References
Pearce RG, Setzer RW, Davis JL, Wambaugh JF (2017).“Evaluation and calibration of high-throughput predictions of chemical distribution to tissues.”Journal of pharmacokinetics and pharmacodynamics,44, 549–565.doi:10.1007/s10928-017-9548-7.
Peyret T, Poulin P, Krishnan K (2010).“A unified algorithm for predicting partition coefficients for PBPK modeling of drugs and environmental chemicals.”Toxicology and applied pharmacology,249(3), 197–207.doi:10.1016/j.taap.2010.09.010.
Poulin P, Haddad S (2012).“Advancing prediction of tissue distribution and volume of distribution of highly lipophilic compounds from a simplified tissue-composition-based model as a mechanistic animal alternative method.”Journal of pharmaceutical sciences,101(6), 2250–2261.doi:10.1002/jps.23090.
Schmitt W (2008).“General approach for the calculation of tissue to plasma partition coefficients.”Toxicology in vitro,22(2), 457–467.doi:10.1016/j.tiv.2007.09.010.
Waters NJ, Jones R, Williams G, Sohal B (2008).“Validation of a rapid equilibrium dialysis approach for the measurement of plasma protein binding.”Journal of pharmaceutical sciences,97(10), 4586–4595.doi:10.1002/jps.21317.
See Also
Calculates the half-life for a one compartment model.
Description
This function calculates the half life from the three compartmentsteady state model where elimination is entirely due to metabolism by theliver and glomerular filtration in the kidneys.
Usage
calc_half_life( chem.cas = NULL, chem.name = NULL, dtxsid = NULL, parameters = NULL, species = "Human", model = "3compartmentss", suppress.messages = TRUE, ...)Arguments
chem.cas | Either the cas number or the chemical name must be specified. |
chem.name | Either the chemical name or the cas number must be specified. |
dtxsid | EPA's 'DSSTox Structure ID (https://comptox.epa.gov/dashboard)the chemical must be identified by either CAS, name, or DTXSIDs |
parameters | Chemical parameters from parameterize_steadystate or1compartment function, overrides chem.name and chem.cas. |
species | Species desired (either "Rat", "Rabbit", "Dog", "Mouse", ordefault "Human"). |
model | The model used to calculate elimination rate (defaults to "3compartmentss") |
suppress.messages | Whether or not the output message is suppressed. |
... | Additional parameters passed to parameterize function if parameters is NULL. |
Details
Half life is calculated by dividing the natural-log of 2 by the eliminationrate from the one compartment model.
Value
Half life | Units of h. |
Author(s)
Sarah E. Davidson
See Also
Examples
calc_half_life(chem.name="Bisphenol A")calc_half_life(chem.name="Bisphenol A",species="Rat")calc_half_life(chem.cas="80-05-7")# Volatiles are outside the domain of default model:try(calc_half_life( chem.name="toluene"))# We can turn off physchem checking:calc_half_life( chem.name="toluene", physchem.exclude=FALSE)# Or use an appropriate model for volatiles:calc_half_life( chem.name="toluene", model="sumclearances")# PFAS are outside the domain:try(calc_half_life( dtxsid="DTXSID8031865", model="sumclearances"))# Can turn off chemical class checking:calc_half_life( dtxsid="DTXSID8031865", model="sumclearances", class.exclude=FALSE, suppress.messages=TRUE)# For a metabolized compound, non-restrictive clearance should be faster:h1 <- calc_half_life( chem.name="toluene", model="sumclearances", suppress.messages=TRUE)h2 <- calc_half_life( chem.name="toluene", model="sumclearances", restrictive.clearance=FALSE, suppress.messages=TRUE)# Check that h2 < h1:if (!(h2 < h1)) stop("h2 not less than h1")# Change species: calc_half_life( dtxsid="DTXSID8031865", species="rat", model="sumclearances", default.to.human=TRUE, class.exclude=FALSE, physchem.exclude=FALSE, suppress.messages=TRUE)Calculate first pass heaptic metabolism
Description
For models that don't described first pass blood flow from the gut, need tocacluate a hepatic bioavailability, that is, the fraction of chemical systemically available after metabolism during the first pass through the liver (Rowland, 1973 Equation 29, where k21 is blood flow through the liverand k23 is clearance from the liver in Figure 1 in that paper).
Usage
calc_hep_bioavailability( chem.cas = NULL, chem.name = NULL, dtxsid = NULL, parameters = NULL, restrictive.clearance = TRUE, default.to.human = FALSE, flow.34 = TRUE, suppress.messages = FALSE, species = "Human")Arguments
chem.cas | Chemical Abstract Services Registry Number (CAS-RN) – ifparameters is not specified then the chemical must be identified by eitherCAS, name, or DTXISD |
chem.name | Chemical name (spaces and capitalization ignored) – ifparameters is not specified then the chemical must be identified by eitherCAS, name, or DTXISD |
dtxsid | EPA's 'DSSTox Structure ID (https://comptox.epa.gov/dashboard)– if parameters is not specified then the chemical must be identified by either CAS, name, or DTXSIDs |
parameters | Parameters from the appropriate parameterization functionfor the model indicated by argument model |
restrictive.clearance | Protein binding not taken into account (set to 1) in liver clearance if FALSE. |
default.to.human | Substitutes missing animal values with human valuesif true (hepatic intrinsic clearance or fraction of unbound plasma). |
flow.34 | A logical constraint |
suppress.messages | Whether or not to suppress the output message. |
species | Species desired (either "Rat", "Rabbit", "Dog", "Mouse", ordefault "Human"). |
Value
A data.table whose columns are the parameters of the HTTK modelspecified inmodel.
Author(s)
John Wambaugh
References
Rowland M, Benet LZ, Graham GG (1973).“Clearance concepts in pharmacokinetics.”Journal of pharmacokinetics and biopharmaceutics,1(2), 123–136.doi:10.1007/BF01059626.
Calculate the hepatic clearance.
Description
This function calculates the hepatic clearance in plasma for using the"well-stirred" model by default. Other scaling options from (Ito and Houston 2004) are also available.Parameters for scaling from flow-free intrinsic-hepatic clearance to whole-liver metabolism rate are taken from (Carlile et al. 1997).In vitro measured hepatic clearace is corrected for estimated binding in the in vitro clearance assay using the model of (Kilford et al. 2008).The agument restrictive.clearance (defaults to TRUE) describes thesignificance (or lack thereof) of plasma protein binding in metabolism. Restrictive clearance assumes that only the free fraction of chemical inplasma is available for metabolism. Non-restrictive clearance assumes that the compound is weakly bound toplasma protein and any free chemical metabolized is instantlyreplaced. For non-restrictive clearance the effective fup = 1.
Usage
calc_hep_clearance( chem.name = NULL, chem.cas = NULL, dtxsid = NULL, parameters = NULL, hepatic.model = "well-stirred", suppress.messages = FALSE, well.stirred.correction = TRUE, restrictive.clearance = TRUE, species = "Human", adjusted.Funbound.plasma = TRUE, ...)Arguments
chem.name | Either the chemical name, CAS number, or the parametersmust be specified. |
chem.cas | Either the chemical name, CAS number, or the parameters mustbe specified. |
dtxsid | EPA's DSSTox Structure ID (https://comptox.epa.gov/dashboard)the chemical must be identified by either CAS, name, or DTXSIDs |
parameters | Chemical parameters from parameterize_steadystatefunction, overrides chem.name and chem.cas. |
hepatic.model | Model used in calculating hepatic clearance, unscaled,parallel tube, dispersion, or default well-stirred. |
suppress.messages | Whether or not to suppress the output message. |
well.stirred.correction | Uses the (Yang et al. 2007) blood:plasma ratio correction in the calculation of hepaticclearance for well-stirred model if TRUE if argument hepatic.model ="well-stirred". |
restrictive.clearance | If TRUE (default)the rate of metabolism is restrictedto the unbound fraction of chemical. If FALSE the free fraction is set to 1(that is, plasma protein binding is weakand metabolzied chemical is rapidly replaced) |
species | Species desired (either "Rat", "Rabbit", "Dog", "Mouse", ordefault "Human"). |
adjusted.Funbound.plasma | Uses the (Pearce et al. 2017) lipid binding adjustmentfor Funbound.plasma (which also impacts partition coefficients such as blood:plasma ratio) when set to TRUE (Default). |
... | Additional parameters passed to parameterize_steadystate ifparameters is NULL. |
Value
Hepatic Clearance | Units of L/h/kg BW. |
Author(s)
John Wambaugh and Robert Pearce
References
Carlile DJ, Zomorodi K, Houston JB (1997).“Scaling factors to relate drug metabolic clearance in hepatic microsomes, isolated hepatocytes, and the intact liver: studies with induced livers involving diazepam.”Drug metabolism and disposition,25(8), 903–911.
Ito K, Houston JB (2004).“Comparison of the use of liver models for predicting drug clearance using in vitro kinetic data from hepatic microsomes and isolated hepatocytes.”Pharmaceutical research,21, 785–792.doi:10.1023/B:PHAM.0000026429.12114.7d.
Kilford PJ, Gertz M, Houston JB, Galetin A (2008).“Hepatocellular binding of drugs: correction for unbound fraction in hepatocyte incubations using microsomal binding or drug lipophilicity data.”Drug Metabolism and Disposition,36(7), 1194–1197.doi:10.1124/dmd.108.020834.
Pearce RG, Setzer RW, Davis JL, Wambaugh JF (2017).“Evaluation and calibration of high-throughput predictions of chemical distribution to tissues.”Journal of pharmacokinetics and pharmacodynamics,44, 549–565.doi:10.1007/s10928-017-9548-7.
Yang J, Jamei M, Yeo KR, Rostami-Hodjegan A, Tucker GT (2007).“Misuse of the well-stirred model of hepatic drug clearance.”Drug Metabolism and Disposition,35(3), 501–502.doi:10.1124/dmd.106.013359.
Examples
calc_hep_clearance(chem.name="Ibuprofen",hepatic.model='unscaled')calc_hep_clearance(chem.name="Ibuprofen",well.stirred.correction=FALSE)Calculate the free chemical in the hepaitic clearance assay
Description
This function uses the method from Kilford et al. (2008) to calculate thefraction of unbound chemical in the hepatocyte intrinsic clearance assay. The bound chemical is presumed to beunavailable during the performance of the assay, so this fraction can beused to increase the apparent clearance rate to better estimate in vivo clearance. For bases, the fraction of chemical unbound in hepatocyte clearance assays (fuhep) is calculated in terms of logPowbut for neutrual and acidic compounds we use logDow (fromcalc_dow). Here we denote the appropriate partition coefficient as "logP/D".Kilford et al. (2008) calculatesfuhep = 1/(1 + 125*VR*10^(0.072*logP/D2 + 0.067*logP/D-1.126))
Usage
calc_hep_fu( chem.cas = NULL, chem.name = NULL, dtxsid = NULL, parameters = NULL, Vr = 0.005, pH = 7.4)Arguments
chem.cas | Chemical Abstract Services Registry Number (CAS-RN) – ifparameters is not specified then the chemical must be identified by eitherCAS, name, or DTXISD |
chem.name | Chemical name (spaces and capitalization ignored) – ifparameters is not specified then the chemical must be identified by eitherCAS, name, or DTXISD |
dtxsid | EPA's 'DSSTox Structure ID (https://comptox.epa.gov/dashboard)– if parameters is not specified then the chemical must be identified by either CAS, name, or DTXSIDs |
parameters | Parameters from the appropriate parameterization functionfor the model indicated by argument model |
Vr | Ratio of cell volume to incubation volume. Default (0.005) is taken from |
pH | pH of the incupation medium. |
Details
Note that octanal:water partitioning above 1:1,000,000 (LogPow > 6)are truncated at 1:1,000,000 because greater partitioning wouldlikely take longer than hepatocyte assay itself.
Value
A numeric fraction between zero and one
Author(s)
John Wambaugh and Robert Pearce
References
Kilford PJ, Gertz M, Houston JB, Galetin A (2008).“Hepatocellular binding of drugs: correction for unbound fraction in hepatocyte incubations using microsomal binding or drug lipophilicity data.”Drug Metabolism and Disposition,36(7), 1194–1197.doi:10.1124/dmd.108.020834.
Wetmore BA, Wambaugh JF, Allen B, Ferguson SS, Sochaski MA, Setzer RW, Houck KA, Strope CL, Cantwell K, Judson RS, others (2015).“Incorporating high-throughput exposure predictions with dosimetry-adjusted in vitro bioactivity to inform chemical toxicity testing.”Toxicological Sciences,148(1), 121–136.doi:10.1093/toxsci/kfv171.
See Also
Calculate the hepatic clearance (deprecated).
Description
This function is included for backward compatibility. It callscalc_hep_clearance whichcalculates the hepatic clearance in plasma for a well-stirred modelor other type if specified. Based on Ito and Houston (2004)
Usage
calc_hepatic_clearance( chem.name = NULL, chem.cas = NULL, dtxsid = NULL, parameters = NULL, species = "Human", default.to.human = FALSE, hepatic.model = "well-stirred", suppress.messages = FALSE, well.stirred.correction = TRUE, restrictive.clearance = TRUE, adjusted.Funbound.plasma = TRUE, ...)Arguments
chem.name | Either the chemical name, CAS number, or the parametersmust be specified. |
chem.cas | Either the chemical name, CAS number, or the parameters mustbe specified. |
dtxsid | EPA's DSSTox Structure ID (https://comptox.epa.gov/dashboard)the chemical must be identified by either CAS, name, or DTXSIDs |
parameters | Chemical parameters from parameterize_steadystatefunction, overrides chem.name and chem.cas. |
species | Species desired (either "Rat", "Rabbit", "Dog", "Mouse", ordefault "Human"). |
default.to.human | Substitutes missing animal values with human valuesif true. |
hepatic.model | Model used in calculating hepatic clearance, unscaled,parallel tube, dispersion, or default well-stirred. |
suppress.messages | Whether or not to suppress the output message. |
well.stirred.correction | Uses correction in calculation of hepaticclearance for well-stirred model if TRUE for hepatic.model well-stirred.This assumes clearance relative to amount unbound in whole blood instead ofplasma, but converted to use with plasma concentration. |
restrictive.clearance | Protein binding not taken into account (set to1) in liver clearance if FALSE. |
adjusted.Funbound.plasma | Whether or not to use Funbound.plasmaadjustment if calculating Rblood2plasma. |
... | Additional parameters passed to parameterize_steadystate ifparameters is NULL. |
Value
Hepatic Clearance | Units of L/h/kg BW. |
Author(s)
John Wambaugh and Robert Pearce
References
Ito, K., & Houston, J. B. (2004). "Comparison of the use of liver models for predicting drug clearance using in vitro kinetic data from hepatic microsomes and isolated hepatocytes." Pharmaceutical Tesearch, 21(5), 785-792.
Examples
calc_hep_clearance(chem.name="Ibuprofen",hepatic.model='unscaled')calc_hep_clearance(chem.name="Ibuprofen",well.stirred.correction=FALSE)Calculate the ionization.
Description
This function calculates the ionization of a compound at a given pH. The pKa's are either entered as parameters or taken from a specific compound inthe package. The arguments pKa_Donor and pKa_Accept may be single numbers, characters, or vectors. We support characters because there are many instances with multiple predicted values and all those values can be included by concatenating with commas (for example, pKa_Donor = "8.1,8.6". Finally, pka_Donor and pKa_Accept may be vectors of characters representing different chemicals or instances ofchemical parameters to allow for uncertainty analysis. A null value forpKa_Donor or pKa_Accept is interpretted as no argument provided, while " " is taken as a prediction of no ionization possible at any pH.
Usage
calc_ionization( chem.cas = NULL, chem.name = NULL, dtxsid = NULL, parameters = NULL, pH = NULL, pKa_Donor = NULL, pKa_Accept = NULL, return_charge_matrix = FALSE)Arguments
chem.cas | Either the chemical name or the CAS number must bespecified. |
chem.name | Either the chemical name or the CAS number must bespecified. |
dtxsid | EPA's 'DSSTox Structure ID (https://comptox.epa.gov/dashboard)the chemical must be identified by either CAS, name, or DTXSIDs |
parameters | Chemical parameters from a parameterize_MODEL function,overrides chem.name and chem.cas. |
pH | pH where ionization is evaluated. |
pKa_Donor | Compound H dissociation equilibirum constant(s).Overwrites chem.name and chem.cas. |
pKa_Accept | Compound H association equilibirum constant(s).Overwrites chem.name and chem.cas. |
return_charge_matrix | If TRUE, the function returns a table describingeach ionization state considered by the calculations in this function(defaults to FALSE) |
Details
It is very important to note that pKb = 14 - pKa. But if a predictor gives usa doinor pKa, we just accept it as a pKa.
For hydrogen donor sites, a hydrogen is present in the molecule that can be donated to the solution if the concentration of hydrogens gets low enough. This causes the molecule to become more negatively charged. This is an acid. For hydrogen acceptor suits a location exist in the molecule that can accept an additional history if the concentration of hydrogens gets sufficiently high. This causes the molecule to become more positively charged. This is a base.
We make several assumptions about ionization in order to make our calculations.First, we assume ionization is either due to either "donating" (losing) ahydrogen ion (a positively charge proton) to the solution or by "accepting"(gaining) a hydrogen ion from the solution. Generally, acids are hydrogen donorsand bases are hydrogen acceptors. Second, pH is the negative log10 concentrationof hydrogen atoms. The lower the pH, the more hydrogen atoms. So, acids donatetheir hydrogen atoms as pH of the solution increases. Bases accept their hydrogenatoms as pH decreases. Third, each predicted pKa is a prediction that a specificlocation (or site) on molecule X can either donate or accept a hydrogen. Fourth, the pKavalue indicates the pH at which half of the molecules of X have ionized atthe site, and half have not. The concentration of the two forms are equal.Fifth, if there are N pKa's for molecule X, then there are N sites that canionize. Technically this means that there are 2^N different ionization statesfor molecule X (where each site is or is not ionized). However, pKa predictorsgive the equlibrium only for pairs of ionization states. So, we only considerN + 1 ionizations states for X – the state immediately above and below eachpKa.
To understand the different charge states we annotate the nonionizable backboneof a molecule as "X". For each site on X that is capable of donating a hydrogenwe add a "D" to the right of "X". For each site on X that has accepted a hydrogen,we add a "A" to the right of "X". We read the A's and D's from left to right,with the one occuring at the lowest pH first. So a typical acid ionization would be:XD -> X- and a typical base ionization would be XA+ -> X. Where things get complicatedis if there are multiple donor and acceptor states. In particular, it is possible for a compound to have a net zero charge, but be simultaneously positively andnegatively charged. Such a state is called a Zwitter ion. For example:XDAA++ -> XAA+ -> XA -> X-. The state XA is technically neutral because' X has donated one hydrogen, but also accepted one hydrogen. XA is a Zwitter ion.
Each pKa gives the equlibrium ratio of two states pH - pKa = log10[X/XD] fordonation or pOH - pka = log10[X/XA] for accepting. pOH = 14 - pH. Separating thelogarithm into log10[X] - log10[XD] lets us see that Cn = Xn - Xn-1 whereCn = pH -pKa for donor pKa's and Cn = 14 - pH - pKa for acceptor pKa's.We can rewrite log10Xn = Sum_i=1:n Ci + log10X1. So we can calculate each Xnby summing all the ratios between Xn and the lowest state (X1). Then, by requiring that all Xi sum to 1, we have:1 = Sum_i=1:N 10^Xi = Sum_i=1:N 10^(Sum_j=1:i (Cj + log10X1)) = X1 * Sum_i=1:N 10^(Sum_j=1:i Cj)so that X1 = 1 / Sum_i=1:N 10^(Sum_j=1:i Cj)
The sum im the denominator is the ratio from X1 to each state (including X1).We use a table called "charge_matrix" to keep track of all N + 1 ionizationstates and the ratio of each state to the next.
Value
fraction_neutral | fraction of compound neutral |
fraction_charged | fraction of compound charged |
fraction_negative | fraction of compound negative |
fraction_positive | fraction of compound positive |
fraction_zwitter | fraction of compound zwitterionic |
charge_matrix | Description of each ionization state if argument return_charge_matrix==TRUE |
Author(s)
Robert Pearce and John Wambaugh
References
Pearce RG, Setzer RW, Davis JL, Wambaugh JF (2017).“Evaluation and calibration of high-throughput predictions of chemical distribution to tissues.”Journal of pharmacokinetics and pharmacodynamics,44, 549–565.doi:10.1007/s10928-017-9548-7.
Strope CL, Mansouri K, Clewell III HJ, Rabinowitz JR, Stevens C, Wambaugh JF (2018).“High-throughput in-silico prediction of ionization equilibria for pharmacokinetic modeling.”Science of The Total Environment,615, 150–160.doi:10.1016/j.scitotenv.2017.09.033.
Examples
# Neutral compound:calc_ionization(chem.name="Acetochlor",pH=7.4)# Donor pKa's 9.78,10.39 -- Should be almost all neutral at plasma pH:out <- calc_ionization(chem.name='bisphenola',pH=7.4)print(out)out[["fraction_neutral"]]==max(unlist(out))# Donor pKa's 9.78,10.39 -- Should be almost all negative (anion) at higher pH:out <- calc_ionization(chem.name='bisphenola',pH=11)print(out)out[["fraction_negative"]]==max(unlist(out))# Ficticious compound, should be almost all all negative (anion):out <- calc_ionization(pKa_Donor=8,pKa_Accept="1,4",pH=9)print(out)out[["fraction_negative"]]>0.9# Donor pKa 6.54 -- Should be mostly negative (anion):out <- calc_ionization(chem.name='Acephate',pH=7)print(out)out[["fraction_negative"]]==max(unlist(out))#Acceptor pKa's "9.04,6.04" -- Should be almost all positive (cation) at plasma pH:out <- calc_ionization(chem.cas="145742-28-5",pH=7.4)print(out)out[["fraction_positive"]]==max(unlist(out))#Ficticious Zwitteron:out <- calc_ionization(pKa_Donor=6,pKa_Accept="8",pH=7.4)print(out)out[["fraction_zwitter"]]==max(unlist(out))Calculate air:matrix partition coefficients
Description
This function uses the methods colleced by Linakis et al. (2020) to calculateair partition coefficients for blood, water, and mucus.
Usage
calc_kair( chem.cas = NULL, chem.name = NULL, dtxsid = NULL, parameters = NULL, species = "Human", adjusted.Funbound.plasma = TRUE, fup.lod.default = 0.005, force.human.clint.fup = FALSE, minimum.Funbound.plasma = 1e-04, default.to.human = FALSE, suppress.messages = FALSE, pH = 7.4, alpha = 0.001)Arguments
chem.cas | Chemical Abstract Services Registry Number (CAS-RN) – ifparameters is not specified then the chemical must be identified by eitherCAS, name, or DTXISD |
chem.name | Chemical name (spaces and capitalization ignored) – ifparameters is not specified then the chemical must be identified by eitherCAS, name, or DTXISD |
dtxsid | EPA's 'DSSTox Structure ID (https://comptox.epa.gov/dashboard)– if parameters is not specified then the chemical must be identified by either CAS, name, or DTXSIDs |
parameters | Parameters from the appropriate parameterization functionfor the model indicated by argument model. Can include parameters "logHenry"and "body_temp", but if not included standard values are looked up from httk tables. |
species | Species used for body temperature, defaults to "Human" |
adjusted.Funbound.plasma | Uses Pearce et al. (2017) lipid binding adjustmentfor Funbound.plasma (which impacts partition coefficients) when set to TRUE (Default). |
fup.lod.default | Default value used for fraction of unbound plasma forchemicals where measured value was below the limit of detection. Defaultvalue is 0.005. |
force.human.clint.fup | Uses human hepatic intrinsic clearance and fractionof unbound plasma in calculation of partition coefficients for rats if true. |
minimum.Funbound.plasma | Monte Carlo draws less than this value are set equal to this value (default is 0.0001 – half the lowest measured Fup in ourdataset). |
default.to.human | Substitutes missing species-specific values with human values ifTRUE (default is FALSE). |
suppress.messages | Whether or not the output messages are suppressed. |
pH | pH where ionization is evaluated. |
alpha | Ratio of Distribution coefficient D of totally charged speciesand that of the neutral form |
Details
The blood:air partition coefficient (PB:A) was calculated as PB:A = PB:A * RB:P / fupwhere P_B:A is the blood:air partition, RB:P is the blood:plasma partitionratio, fup is the fraction unbound in the plasma, andP_W:A is the water:air partition coefficient:R * Tbody / HLC / Pwhere R is the gas constant (8.314 J/mol/K), T_body is the species-specific body temperature (K) fromphysiology.data,HLC is the Henry's Law Constant (atm*m^3 / mol), and P is conversion factor from atmospheres to Pascals (1 atm = 101325 Pa).
In the isopropanol PBTKmodel published by Clewell et al. (2001) it was noted that certain chemicals are likely to be absorbed into the mucus or otherwisetrapped in the upper respiratory tract (URT). Following Scott (2014), the air:mucus partition coefficient (PA:M) calculated aslog10(1/Kwater2air) - (log10(Pow) - 1) * 0.524where Pow is the octanol/water partition coefficient
Value
A named list containing the blood:air, water:air, and mucus:air partition coefficients
Author(s)
John Wambaugh and Matt Linakis
References
Linakis MW, Sayre RR, Pearce RG, Sfeir MA, Sipes NS, Pangburn HA, Gearhart JM, Wambaugh JF (2020).“Development and evaluation of a high-throughput inhalation model for organic chemicals.”Journal of exposure science & environmental epidemiology,30(5), 866–877.doi:10.1038/s41370-020-0238-y.
Clewell III, Harvey J., et al. "Development of a physiologically based pharmacokinetic model of isopropanol and its metabolite acetone." Toxicological Sciences 63.2 (2001): 160-172.
Scott, John W., et al. "Tuning to odor solubility and sorption pattern in olfactory epithelial responses." Journal of Neuroscience 34.6 (2014): 2025-2036.
See Also
Back-calculates the Red Blood Cell to Unbound Plasma Partition Coefficient
Description
Given an observed ratio of chemical concentration in blood to plasma, thisfunction calculates a Red Blood Cell to unbound plasma (Krbc2pu) partitioncoefficient that would be consistent with that observation.
Usage
calc_krbc2pu( Rb2p, Funbound.plasma, hematocrit = NULL, default.to.human = FALSE, species = "Human", suppress.messages = TRUE)Arguments
Rb2p | The chemical blood:plasma concentration ratop |
Funbound.plasma | The free fraction of chemical in the presence of plasma proteinRblood2plasma. |
hematocrit | Overwrites default hematocrit value in calculatingRblood2plasma. |
default.to.human | Substitutes missing animal values with human valuesif true. |
species | Species desired (either "Rat", "Rabbit", "Dog", "Mouse", ordefault "Human"). |
suppress.messages | Determine whether to display certain usagefeedback. |
Value
The red blood cell to unbound chemical in plasma partition coefficient.
Author(s)
John Wambaugh and Robert Pearce
References
Pearce RG, Setzer RW, Davis JL, Wambaugh JF (2017).“Evaluation and calibration of high-throughput predictions of chemical distribution to tissues.”Journal of pharmacokinetics and pharmacodynamics,44, 549–565.doi:10.1007/s10928-017-9548-7.
Ruark CD, Hack CE, Robinson PJ, Mahle DA, Gearhart JM (2014).“Predicting passive and active tissue: plasma partition coefficients: interindividual and interspecies variability.”Journal of pharmaceutical sciences,103(7), 2189–2198.doi:10.1002/jps.24011.
Calculate the membrane affinity
Description
Membrane affinity (MA) is the membrane:water partition coefficient. MAchacterizes chemical partitioning into membranes formedfrom neutral phospholipids (KnPL). Pearce et al. (2017) compared five different methods for predicting membrane affinity using measured data for 59 compounds. The method ofYun and Edgington (2013) was identified as the best: MA = 10^(1.294 + 0.304 * log10(Pow)
Usage
calc_ma( chem.cas = NULL, chem.name = NULL, dtxsid = NULL, parameters = NULL, suppress.messages = FALSE, pfas.calibration = TRUE)Arguments
chem.cas | Chemical Abstract Services Registry Number (CAS-RN) – ifparameters is not specified then the chemical must be identified by eitherCAS, name, or DTXISD |
chem.name | Chemical name (spaces and capitalization ignored) – ifparameters is not specified then the chemical must be identified by eitherCAS, name, or DTXISD |
dtxsid | EPA's 'DSSTox Structure ID (https://comptox.epa.gov/dashboard)– if parameters is not specified then the chemical must be identified by either CAS, name, or DTXSIDs |
parameters | Parameters from the appropriate parameterization functionfor the model indicated by argument model |
suppress.messages | Whether or not the output message is suppressed. |
pfas.calibration | Whether MA for chemicals in class PFAS should beincreased using the regression to the Droge (2019) dataset. |
Value
A membrane:unbound fraction in plasma partition coefficient
Author(s)
John Wambaugh
References
Pearce RG, Setzer RW, Davis JL, Wambaugh JF (2017).“Evaluation and calibration of high-throughput predictions of chemical distribution to tissues.”Journal of pharmacokinetics and pharmacodynamics,44, 549–565.doi:10.1007/s10928-017-9548-7.
Yun YE, Edginton AN (2013).“Correlation-based prediction of tissue-to-plasma partition coefficients using readily available input parameters.”Xenobiotica,43(10), 839–852.doi:10.3109/00498254.2013.770182.
Droge STJ (2019).“Membrane?Water Partition Coefficients to Aid Risk Assessment of Perfluoroalkyl Anions and Alkyl Sulfates.”Environmental Science & Technology,53(2), 760-770.doi:10.1021/acs.est.8b05052.PMID: 30572703, https://doi.org/10.1021/acs.est.8b05052.
Calculate maternal body weight
Description
This function initializes the parameters needed in the functionssolve_fetal_pbtk by calling solve_pbtk and adding additional parameters.
Usage
calc_maternal_bw(week = 12)Arguments
week | Gestational week |
Details
BW <- params$pre_pregnant_BW + params$BW_cubic_theta1 * tw + params$BW_cubic_theta2 * tw^2 + params$BW_cubic_theta3 * tw^3
Value
BW | Maternal Body Weight, kg. |
Author(s)
John Wambaugh
References
Kapraun DF, Wambaugh JF, Setzer RW, Judson RS (2019).“Empirical models for anatomical and physiological changes in a human mother and fetus during pregnancy and gestation.”PLOS ONE,14(5), 1-56.doi:10.1371/journal.pone.0215906.
Distribution of chemical steady state concentration with uncertainty and variability
Description
For a given chemical and fixed dose rate this function determines a distribution of steady-state concentrations reflecting measurement uncertaintyan population variability. Uncertainty and variability are simulated via theMonte Carlo method – many sets of model parameters are drawn according toprobability distributions described in Ring et al. (2017) (doi:10.1016/j.envint.2017.06.004)for human variability and Wambaugh et al. (2019) (doi:10.1093/toxsci/kfz205) for measurement uncertainty. Monte Carlo samples are generated by the functioncreate_mc_samples. To allow rapid application of the Monte Carlo method we make use of analytical solutions for the steady-state concentrationfor a particular model via a given route (when available) as opposed tosolving the model numerically (that is, using differential equations).For each sample of the Monte Carlo method (as specified by argumentsamples) the parameters for the analytical solution are varied. Anensemble of steady-state predictions are produced, though by default onlythe quantiles specified by argumentwhich.quantile are provided. If the full set of predicted values are desired use set the argumentreturn.samples toTRUE.
Usage
calc_mc_css( chem.cas = NULL, chem.name = NULL, dtxsid = NULL, parameters = NULL, samples = 1000, which.quantile = 0.95, species = "Human", daily.dose = 1, suppress.messages = FALSE, model = "3compartmentss", httkpop = TRUE, httkpop.dt = NULL, invitrouv = TRUE, calcrb2p = TRUE, censored.params = list(), vary.params = list(), return.samples = FALSE, tissue = NULL, concentration = "plasma", output.units = "mg/L", invitro.mc.arg.list = NULL, httkpop.generate.arg.list = list(method = "direct resampling"), convert.httkpop.arg.list = NULL, parameterize.args.list = NULL, calc.analytic.css.arg.list = NULL, Caco2.options = NULL)Arguments
chem.cas | Chemical Abstract Services Registry Number (CAS-RN) – ifparameters is not specified then the chemical must be identified by eitherCAS, name, or DTXISD |
chem.name | Chemical name (spaces and capitalization ignored) – ifparameters is not specified then the chemical must be identified by eitherCAS, name, or DTXISD |
dtxsid | EPA's DSSTox Structure ID (https://comptox.epa.gov/dashboard)– if parameters is not specified then the chemical must be identified by either CAS, name, or DTXSIDs |
parameters | Parameters from the appropriate parameterization functionfor the model indicated by argument model |
samples | Number of samples generated in calculating quantiles. |
which.quantile | Which quantile from Monte Carlo simulation isrequested. Can be a vector. |
species | Species desired (either "Rat", "Rabbit", "Dog", "Mouse", ordefault "Human"). Species must be set to "Human" to run httkpop model. |
daily.dose | Total daily dose, mg/kg BW. |
suppress.messages | Whether or not to suppress output message. |
model | Model used in calculation,'gas_pbtk' for the gas pbtk model, 'pbtk' for the multiple compartment model,'3compartment' for the three compartment model, '3compartmentss' for the three compartment steady state model, and '1compartment' for one compartment model. This only applies when httkpop=TRUE and species="Human",otherwise '3compartmentss' is used. |
httkpop | Whether or not to use population generator and sampler fromhttkpop. This is overwrites censored.params and vary.params and is only forhuman physiology. Species must also be set to 'Human'. |
httkpop.dt | A data table generated by |
invitrouv | Logical to indicate whether to include in vitro parametersin uncertainty and variability analysis |
calcrb2p | Logical determining whether or not to recalculate the chemical ratio of blood to plasma |
censored.params | The parameters listed in censored.params are sampledfrom a normal distribution that is censored for values less than the limitof detection (specified separately for each parameter). This argument shouldbe a list of sublists. Each sublist is named for a parameter in"parameters" and contains two elements: "CV" (coefficient of variation) and"LOD" (limit of detection, below which parameter values are censored. Newvalues are sampled with mean equal to the value in "parameters" and standarddeviation equal to the mean times the CV. Censored values are sampled on auniform distribution between 0 and the limit of detection. Not used withhttkpop model. |
vary.params | The parameters listed in vary.params are sampled from anormal distribution that is truncated at zero. This argument should be alist of coefficients of variation (CV) for the normal distribution. Eachentry in the list is named for a parameter in "parameters". New values aresampled with mean equal to the value in "parameters" and standard deviationequal to the mean times the CV. Not used with httkpop model. |
return.samples | Whether or not to return the vector containing thesamples from the simulation instead of the selected quantile. |
tissue | Desired steady state tissue concentration. Default is of NULLtypically gives whole body plasma concentration. |
concentration | Desired concentration type: 'blood','tissue', or default 'plasma'. In the case that the concentration is for plasma, selecting "blood"will use the blood:plasma ratio to estimate blood concentration. In the casethat the argument 'tissue' specifies a particular tissue of the body, concentration defaults to 'tissue' – that is, the concentration in the If cocentration is set to 'blood' or 'plasma' and 'tissue' specifies aspecific tissue then the value returned is for the plasma or blood in thatspecific tissue. |
output.units | Plasma concentration units, either uM or default mg/L. |
invitro.mc.arg.list | List of additional parameters passed to |
httkpop.generate.arg.list | Additional parameters passed to |
convert.httkpop.arg.list | Additional parameters passed to the convert_httkpop_* function for the model. |
parameterize.args.list | A list of arguments to be passed to the modelparameterization function (that is, parameterize_MODEL) corresponding toargument "model". (Defaults to NULL.) |
calc.analytic.css.arg.list | Additional parameters passed to |
Caco2.options | Arguments describing how to handle Caco2 absorption datathat are passed to |
Details
The chemical-specific steady-state concentration for a dose rate of 1 mg/kg body weight/day can be used for inin vitro-in vivo extrapolation (IVIVE) ofa bioactivein vitro concentration by dividing thein vitroconcentrationby the steady-state concentration to predict a dose rate (mg/kg/day) thatwould produce that concentration in plasma. Using quantiles of the distribution (such as the upper 95th percentile) allow incorporation of uncertainty and variability into IVIVE.
Reverse Dosimetry Toxicodynamic IVIVE

Figure from Breen et al. (2021) (doi:10.1080/17425255.2021.1935867) shows reverse dosimetry toxicodynamic IVIVE. Equivalent external dose isdetermined by solving the TK model in reverse by deriving the external dose(that is, TK model input) that produces a specified internal concentration (that is, TK model output). Reverse dosimetry and IVIVE using HTTK relies on the linearity of the models. We calculate a scaling factor to relatein vitro concentrations (uM) to administered equivalent doses (AED). The scaling factor is the inverse of the steady state plasma concentration (Css) predicted for a 1 mg/kg/day exposure dose rate. We use Monte Carlo to simulate variability and propagate uncertainty; for example, to calculate an upper 95th percentile Css,95 for individuals who get higher plasma concentrations from the same exposure.
The Monte Carlo methods used here were recently updated and described byBreen et al. (submitted).
httk-pop is used only for humans. For non-human species biological variability is simulated by drawing parameters from uncorellated log-normaldistributions.
Chemical-specific httk data are available primarily for human and for a fewhundred chemicals in rat. All in silico predictions are for human. Thus, when species is specified as rabbit, dog, or mouse, the user can chooseto set the argumentdefault.to.human toTRUE so that this function uses theappropriate physiological data (volumes and flows) but substitutes humanfraction unbound, partition coefficients, and intrinsic hepatic clearance.
If the argumenttissue is used, the steady-state concentration in thattissue, if available, is provided. If that tissue is included in the modelused (specified by arguementmodel) then the actual tissue concentration isprovided. Otherwise, the tissue-specific partition coefficient is used toestimate the concentration from the plasma.
The six sets of plausible IVIVEassumptions identified by Honda et al. (2019) (doi:10.1371/journal.pone.0217564) are:
| in vivo Conc. | Metabolic Clearance | Bioactive ChemicalConc. | TK Statistic Used* | |
| Honda1 | Veinous (Plasma) | Restrictive | Free | Mean Conc. |
| Honda2 | Veinous | Restrictive | Free | Max Conc. |
| Honda3 | Veinous | Non-restrictive | Total | Mean Conc. |
| Honda4 | Veinous | Non-restrictive | Total | Max Conc. |
| Honda5 | Target Tissue | Non-restrictive | Total | Mean Conc. |
| Honda6 | Target Tissue | Non-restrictive | Total | Max Conc. |
*Assumption iscurrently ignored because analytical steady-state solutions are currentlyused by this function.
Value
Quantiles (specified by which.quantile) of the distribution of plasmasteady-stae concentration (Css) from the Monte Carlo simulation
Author(s)
Caroline Ring, Robert Pearce, John Wambaugh, Miyuki Breen, and Greg Honda
References
Wambaugh JF, Wetmore BA, Pearce R, Strope C, Goldsmith R, Sluka JP, Sedykh A, Tropsha A, Bosgra S, Shah I, others (2015).“Toxicokinetic triage for environmental chemicals.”Toxicological Sciences,147(1), 55–67.doi:10.1093/toxsci/kfv118.
Ring CL, Pearce RG, Setzer RW, Wetmore BA, Wambaugh JF (2017).“Identifying populations sensitive to environmental chemicals by simulating toxicokinetic variability.”Environment International,106, 105–118.doi:10.1016/j.envint.2017.06.004.
Honda GS, Pearce RG, Pham LL, Setzer RW, Wetmore BA, Sipes NS, Gilbert J, Franz B, Thomas RS, Wambaugh JF (2019).“Using the concordance of in vitro and in vivo data to evaluate extrapolation assumptions.”PloS one,14(5), e0217564.doi:10.1371/journal.pone.0217564.
Rowland M, Benet LZ, Graham GG (1973).“Clearance concepts in pharmacokinetics.”Journal of pharmacokinetics and biopharmaceutics,1(2), 123–136.doi:10.1007/BF01059626.
Breen M, Wambaugh JF, Bernstein A, Sfeir M, Ring CL (2022).“Simulating toxicokinetic variability to identify susceptible and highly exposed populations.”Journal of Exposure Science & Environmental Epidemiology,32(6), 855–863.doi:10.1038/s41370-022-00491-0.
See Also
Examples
# Set the number of samples (NSAMP) to a small value for rapid testing, # increase NSAMP for more stable (reproducible) results. Default value is 1000:NSAMP = 100# Basic in vitro - in vivo extrapolation with httk, convert 3 uM in vitro# concentration of chemical with CAS 2451-62-9 to mg/kg/day:set.seed(1234)3/calc_mc_css(chem.cas="2451-62-9", samples=NSAMP, output.units="uM")# The significant digits should give the same answer as:set.seed(1234)calc_mc_oral_equiv(chem.cas="2451-62-9", conc=3, samples=NSAMP) # By default human variability is simulated using httk-pop based upon actual# individuals from three recent NHANES cohorts (see Breen et al., 2022):set.seed(1234)calc_mc_css(chem.name='Bisphenol A', output.units='uM', samples=NSAMP, return.samples=TRUE)# However, as described in Ring et al. (2017) we can also sample using# virtual individuals drawn from distributions determiend from the NHANES# cohorts (this is method "vi"):set.seed(1234)calc_mc_css(chem.name='Bisphenol A', output.units='uM', samples=NSAMP, httkpop.generate.arg.list=list(method='vi')) # We can also tailor the NHANES cohort to provide variability simulation of # specific populations:set.seed(1234)calc_mc_css(chem.cas = "80-05-7", which.quantile = 0.5, output.units = "uM", samples = NSAMP, httkpop.generate.arg.list=list(method='vi', gendernum=NULL, agelim_years=NULL, agelim_months=NULL, weight_category = c("Underweight", "Normal", "Overweight", "Obese" ) ) )# The following example should result in an error since we do not # estimate tissue partitioning with '3compartmentss', which does not have# tissues: set.seed(1234)try(calc_mc_css(chem.name='2,4-d', which.quantile=.9, samples=NSAMP, httkpop=FALSE, tissue='heart')) # But heart will work with PBTK, even though it's lumped since we estimate# a partition coefficient before lumping:set.seed(1234)calc_mc_css(chem.name='2,4-d', model='pbtk', samples=NSAMP, which.quantile=.9, httkpop=FALSE, tissue='heart')# It is also possible to use this function with a vector of model parameters,# although you must specify the model to which the parameters correspond:params <- parameterize_pbtk(chem.cas="80-05-7")set.seed(1234)calc_mc_css(parameters=params,model="pbtk", samples=NSAMP)# By default the standard HTTK Monte Carlo uses httk-pop (Ring et al., 2017):set.seed(1234)calc_mc_css(chem.cas="90-43-7", model="pbtk", samples=NSAMP)# We can use HTTK Monte Carlo with no measurement uncertainty (this is how # monte carlo was performed before v1.10.0):set.seed(1234)calc_mc_css(chem.cas="90-43-7", model="pbtk", samples=NSAMP, invitro.mc.arg.list = list( adjusted.Funbound.plasma = TRUE, poormetab = TRUE, fup.censored.dist = FALSE, fup.lod = 0.01, fup.meas.cv = 0.0, clint.meas.cv = 0.0, fup.pop.cv = 0.3, clint.pop.cv = 0.3)) # HTTK Monte Carlo with no HTTK-Pop physiological variability):set.seed(1234)calc_mc_css(chem.cas="90-43-7",model="pbtk",samples=NSAMP,httkpop=FALSE)# HTTK Monte Carlo with no in vitro uncertainty and variability):set.seed(1234)calc_mc_css(chem.cas="90-43-7",model="pbtk",samples=NSAMP,invitrouv=FALSE)# HTTK Monte Carlo with no HTTK-Pop and no in vitro uncertainty and variability):set.seed(1234)calc_mc_css(chem.cas="90-43-7" ,model="pbtk", samples=NSAMP, httkpop=FALSE, invitrouv=FALSE)# Should be the same as the mean result:calc_analytic_css(chem.cas="90-43-7",model="pbtk",output.units="mg/L")# HTTK Monte Carlo using basic Monte Carlo sampler:set.seed(1234)calc_mc_css(chem.cas="90-43-7", model="pbtk", samples=NSAMP, httkpop=FALSE, invitrouv=FALSE, vary.params=list(Pow=0.3)) # The following will not work because Diquat dibromide monohydrate's # Henry's Law Constant (-3.912) is higher than that of Acetone (~-4.5):try(calc_mc_css(chem.cas="6385-62-2"))# However, we can turn off checking for phys-chem properties, since we know# that Diquat dibromide monohydrate is not too volatile:calc_mc_css(chem.cas="6385-62-2", parameterize.args.list =list(physchem.exclude=FALSE))# We can also use the Monte Carlo functions by passing a table# where each row represents a different Monte Carlo draw of parameters:p <- create_mc_samples(chem.cas="80-05-7")# Use data.table for steady-state plasma concentration (Css) Monte Carlo:calc_mc_css(parameters=p)# Using the same table gives the same answer:calc_mc_css(parameters=p)# Use Css for 1 mg/kg/day for simple reverse toxicokinetics # in Vitro-In Vivo Extrapolation to convert 15 uM to mg/kg/day:15/calc_mc_css(parameters=p, output.units="uM")# Can do the same with calc_mc_oral_equiv:calc_mc_oral_equiv(15, parameters=p)# HTTK Monte Carlo using basic Monte Carlo sampler:set.seed(1234)calc_mc_css(chem.cas="90-43-7", model="pbtk", samples=NSAMP, httkpop=FALSE, invitrouv=FALSE, vary.params=list(Pow=0.3))# make sure the oral equivalent function works:set.seed(1234)calc_mc_oral_equiv(chem.name="bisphenol a",conc=10,samples=NSAMP)set.seed(1234)# Do the calculation manually to make sure units are correct:signif(10/calc_mc_css(chem.name="bisphenol a",samples=NSAMP,output.units="uM"),4)# do test of passing data.table of parametersset.seed(1234)parameter.dt <- create_mc_samples(chem.cas="335104-84-2", model="pbtk", samples=NSAMP)calc_mc_oral_equiv(conc=100, parameters=parameter.dt, model="pbtk", samples=NSAMP)# do test of passing single set of parametersparams <- parameterize_steadystate(chem.cas="80-05-7")css3 <- calc_analytic_css( parameters=params, output.units = "uM", model = "3compartmentss", species = "Human")set.seed(1234)css4 <- calc_mc_css( parameters=params, output.units = "uM", model = "3compartmentss", species = "Human", httkpop=FALSE, invitrouv=FALSE, return.samples=TRUE, samples=NSAMP)set.seed(1234)css5 <- calc_mc_css( parameters=params, output.units = "uM", model = "3compartmentss", species = "Human", httkpop=TRUE, invitrouv=TRUE, return.samples=TRUE, samples=NSAMP)# If we turn off all the montecarlo the samples should all be the same and# give us the same result as calc_analytic_css:set.seed(1234)css1 <- calc_mc_css( chem.cas = "80-05-7", output.units = "uM", model = "3compartmentss", species = "Human", httkpop=FALSE, invitrouv=FALSE, return.samples=TRUE, samples=NSAMP)set.seed(1234)css2 <- calc_analytic_css( chem.cas = "80-05-7", output.units = "uM", model = "3compartmentss", species = "Human")# These values should be the same:all(mean(abs(signif((css1-css2)/css2,4)))<0.001)css2/css3==1# Because we can't recalculate Rblood2plasma for 3compartmentss this is not# quite the same but should be close:unique(css4)/css2# Now test that MC works across different models:set.seed(1234)calc_mc_css(chem.cas="15972-60-8",model="3compartment",samples=NSAMP)set.seed(1234)calc_mc_css(chem.cas="15972-60-8",model="1compartment",samples=NSAMP)set.seed(1234)calc_mc_css(chem.cas="15972-60-8",model="pbtk",samples=NSAMP)# Should be the same as the mean result:calc_analytic_css(chem.cas="90-43-7",model="pbtk",output.units="mg/L")Calculate Monte Carlo Oral Equivalent Dose
Description
This function converts a chemical plasma concentration to an oral administeredequivalentdose (AED) using a concentration obtained fromcalc_mc_css. This function uses reverse dosimetry-based 'in vitro-in vivo extrapolation (IVIVE) for high throughput risk screening. The user can input thechemical andin vitro bioactive concentration, select the TKmodel, and then automatically predict thein vivo AEDwhich would produce a body concentration equal tothein vitro bioactive concentration. This function relies on theMonte Carlo method (via functioncreate_mc_samples to simulateboth uncertainty and variability so that the result is a distribution ofequivalent doses, from which we provide specific quantiles(specified bywhich.quantile), though the full set of predictions canbe obtained by settingreturn.samples toTRUE.
Usage
calc_mc_oral_equiv( conc, chem.name = NULL, chem.cas = NULL, dtxsid = NULL, parameters = NULL, which.quantile = 0.95, species = "Human", input.units = "uM", output.units = "mgpkgpday", suppress.messages = FALSE, return.samples = FALSE, restrictive.clearance = TRUE, bioactive.free.invivo = FALSE, tissue = NULL, concentration = "plasma", IVIVE = NULL, model = "3compartmentss", Caco2.options = list(), calc.analytic.css.arg.list = list(), ...)Arguments
conc | Bioactive in vitro concentration in units of uM. |
chem.name | Either the chemical name or the CAS number must bespecified. |
chem.cas | Either the CAS number or the chemical name must bespecified. |
dtxsid | EPA's 'DSSTox Structure ID (https://comptox.epa.gov/dashboard)the chemical must be identified by either CAS, name, or DTXSIDs |
parameters | Parameters from the appropriate parameterization functionfor the model indicated by argument model |
which.quantile | Which quantile from Monte Carlo steady-statesimulation ( |
species | Species desired (either "Rat", "Rabbit", "Dog", "Mouse", ordefault "Human"). |
input.units | Units of given concentration, default of uM but can alsobe mg/L. |
output.units | Units of dose, default of 'mgpkgpday' for mg/kg BW/ day or'umolpkgpday' for umol/ kg BW/ day. |
suppress.messages | Suppress text messages. |
return.samples | Whether or not to return the vector containing thesamples from the simulation instead of the selected quantile. |
restrictive.clearance | Protein binding not taken into account (set to1) in liver clearance if FALSE. |
bioactive.free.invivo | If FALSE (default), then the total concentration is treatedas bioactive in vivo. If TRUE, the the unbound (free) plasma concentration is treated as bioactive in vivo. Only works with tissue = NULL in current implementation. |
tissue | Desired steady state tissue concentration. Default is of NULLtypically gives whole body plasma concentration. |
concentration | Desired concentration type: 'blood','tissue', or default 'plasma'. In the case that the concentration is for plasma, selecting "blood"will use the blood:plasma ratio to estimate blood concentration. In the casethat the argument 'tissue' specifies a particular tissue of the body, concentration defaults to 'tissue' – that is, the concentration in the If cocentration is set to 'blood' or 'plasma' and 'tissue' specifies aspecific tissue then the value returned is for the plasma or blood in thatspecific tissue. |
IVIVE | Honda et al. (2019) identified six plausible sets ofassumptions forin vitro-in vivo extrapolation (IVIVE) assumptions.Argument may be set to "Honda1" through "Honda6". If used, this functionoverwrites the tissue, restrictive.clearance, and bioactive.free.invivo arguments.See Details below for more information. |
model | Model used in calculation,'gas_pbtk' for the gas pbtk model, 'pbtk' for the multiple compartment model,'3compartment' for the three compartment model, '3compartmentss' for the three compartment steady state model, and '1compartment' for one compartment model. This only applies when httkpop=TRUE and species="Human",otherwise '3compartmentss' is used. |
Caco2.options | A list of options to use when working with Caco2 apical tobasolateral data |
calc.analytic.css.arg.list | A list of options to pass to the analytic steady-state calculation function.This includes 'restrictive.clearance', 'bioactive.free.invivo', 'IVIVE','wellstirred.correction', and 'adjusted.Funbound.plasma'. |
... | Additional parameters passed to |
Details
The chemical-specific steady-state concentration for a dose rate of 1 mg/kg body weight/day can be used for in IVIVE ofa bioactivein vitro concentration by dividing thein vitroconcentrationby the steady-state concentration to predict a dose rate (mg/kg/day) thatwould produce that concentration in plasma. Using quantiles of the distribution (such as the upper 95th percentile) allow incorporation of uncertainty and variability into IVIVE.
This approach relies on the linearityof the models to calculate a scaling factor to relatein vitroconcentrations (uM) with AED. The scaling factor is theinverse of the steady-state plasma concentration (Css) predictedfor a 1 mg/kg/day exposure dose ratewherein vitro concentration [X] and Css must be in the sameunits. Note that it is typical forin vitro concentrations to bereported in units of uM and Css in units of mg/L, in which caseone must be converted to the other.
Reverse Dosimetry Toxicodynamic IVIVE
Figure from Breen et al. (2021) (doi:10.1080/17425255.2021.1935867) shows reverse dosimetry toxicodynamic IVIVE. Equivalent external dose isdetermined by solving the TK model in reverse by deriving the external dose(that is, TK model input) that produces a specified internal concentration (that is, TK model output). Reverse dosimetry and IVIVE using HTTK relies on the linearity of the models. We calculate a scaling factor to relatein vitro concentrations (uM) to AEDs. The scaling factor is the inverse of the Css predicted for a 1 mg/kg/day exposure dose rate. We use Monte Carlo to simulate variability and propagate uncertainty; for example, to calculate an upper 95th percentile Css,95 for individuals who get higher plasma concentrations from the same exposure.
The Monte Carlo methods used here were recently updated and described byBreen et al. (submitted).
All arguments after httkpop only apply if httkpop is set to TRUE and speciesto "Human".
When species is specified as rabbit, dog, or mouse, the function uses theappropriate physiological data(volumes and flows) but substitutes humanfraction unbound, partition coefficients, and intrinsic hepatic clearance.
Tissue concentrations are calculated for the pbtk model with oral infusiondosing. All tissues other than gut, liver, and lung are the product of thesteady state plasma concentration and the tissue to plasma partitioncoefficient.
The six sets of plausible IVIVEassumptions identified by Honda et al. (2019) (doi:10.1371/journal.pone.0217564) are:
| in vivo Conc. | Metabolic Clearance | Bioactive ChemicalConc. | TK Statistic Used* | |
| Honda1 | Veinous (Plasma) | Restrictive | Free | Mean Conc. |
| Honda2 | Veinous | Restrictive | Free | Max Conc. |
| Honda3 | Veinous | Non-restrictive | Total | Mean Conc. |
| Honda4 | Veinous | Non-restrictive | Total | Max Conc. |
| Honda5 | Target Tissue | Non-restrictive | Total | Mean Conc. |
| Honda6 | Target Tissue | Non-restrictive | Total | Max Conc. |
*Assumption iscurrently ignored because analytical steady-state solutions are currentlyused by this function.
Value
Equivalent dose in specified units, default of mg/kg BW/day.
Author(s)
John Wambaugh
References
Ring CL, Pearce RG, Setzer RW, Wetmore BA, Wambaugh JF (2017).“Identifying populations sensitive to environmental chemicals by simulating toxicokinetic variability.”Environment International,106, 105–118.doi:10.1016/j.envint.2017.06.004.
Wetmore BA, Wambaugh JF, Allen B, Ferguson SS, Sochaski MA, Setzer RW, Houck KA, Strope CL, Cantwell K, Judson RS, others (2015).“Incorporating high-throughput exposure predictions with dosimetry-adjusted in vitro bioactivity to inform chemical toxicity testing.”Toxicological Sciences,148(1), 121–136.doi:10.1093/toxsci/kfv171.
Honda GS, Pearce RG, Pham LL, Setzer RW, Wetmore BA, Sipes NS, Gilbert J, Franz B, Thomas RS, Wambaugh JF (2019).“Using the concordance of in vitro and in vivo data to evaluate extrapolation assumptions.”PloS one,14(5), e0217564.doi:10.1371/journal.pone.0217564.
Rowland M, Benet LZ, Graham GG (1973).“Clearance concepts in pharmacokinetics.”Journal of pharmacokinetics and biopharmaceutics,1(2), 123–136.doi:10.1007/BF01059626.
See Also
Examples
# Set the number of samples (NSAMP) low for rapid testing, increase NSAMP # for more stable results. Default value is 1000:NSAMP = 10# Basic in vitro - in vivo extrapolation with httk, convert 0.5 uM in vitro# concentration of chemical Surinabant to mg/kg/day:set.seed(1234)0.5/calc_mc_css(chem.name="Surinabant", samples=NSAMP, output.units="uM")# The significant digits should give the same answer as:set.seed(1234)calc_mc_oral_equiv(chem.name="Surinabant",conc=0.5,samples=NSAMP) # Note that we use set.seed to get the same sequence of random numbers for# the two different function calls (calc_mc_css and calc_mc_oral_equiv)# The following example should result in an error since we do not # estimate tissue partitioning with '3compartmentss'. set.seed(1234) try(calc_mc_oral_equiv(0.1, chem.cas="34256-82-1", which.quantile=c(0.05,0.5,0.95), samples=NSAMP, tissue='brain')) set.seed(1234)calc_mc_oral_equiv(0.1,chem.cas="34256-82-1", model='pbtk', samples=NSAMP, which.quantile=c(0.05,0.5,0.95), tissue='brain') # The following will not work because Diquat dibromide monohydrate's # Henry's Law Constant (-3.912) is higher than that of Acetone (~-4.5):try(calc_mc_oral_equiv(3, chem.cas="6385-62-2"))# However, we can turn off checking for phys-chem properties, since we know# that Diquat dibromide monohydrate is not too volatile:calc_mc_oral_equiv(3, chem.cas="6385-62-2", parameterize.args.list =list(physchem.exclude=FALSE)) # We can also use the Monte Carlo functions by passing a table# where each row represents a different Monte Carlo draw of parameters:p <- create_mc_samples(chem.cas="80-05-7")# Use data.table for steady-state plasma concentration (Css) Monte Carlo:calc_mc_css(parameters=p)# Using the same table gives the same answer:calc_mc_css(parameters=p)# Use Css for 1 mg/kg/day for simple reverse toxicokinetics # in Vitro-In Vivo Extrapolation to convert 15 uM to mg/kg/day:15/calc_mc_css(parameters=p, output.units="uM")# Can do the same with calc_mc_oral_equiv:calc_mc_oral_equiv(15, parameters=p)Conduct multiple TK simulations using Monte Carlo
Description
Solves a model for concentration vs. time predictions usingMonte Carlo methods
Usage
calc_mc_tk( chem.cas = NULL, chem.name = NULL, dtxsid = NULL, parameters = NULL, samples = 1000, species = "Human", suppress.messages = FALSE, model = "pbtk", httkpop = TRUE, httkpop.dt = NULL, invitrouv = TRUE, calcrb2p = TRUE, censored.params = list(), vary.params = list(), return.samples = FALSE, tissue = NULL, output.units = "mg/L", solvemodel.arg.list = list(times = c(0, 0.25, 0.5, 0.75, 1, 1.5, 2, 2.5, 3, 4, 5)), Caco2.options = list(), invitro.mc.arg.list = NULL, httkpop.generate.arg.list = list(method = "direct resampling"), convert.httkpop.arg.list = NULL, parameterize.args.list = NULL, propagate.invitrouv.arg.list = NULL, return.all.sims = FALSE)Arguments
chem.cas | Either the CAS number, parameters, or the chemical name mustbe specified. |
chem.name | Either the chemical parameters, name, or the CAS number mustbe specified. |
dtxsid | EPA's DSSTox Structure ID(https://comptox.epa.gov/dashboard) the chemical must be identifiedby either CAS, name, or DTXSIDs |
parameters | Parameters from parameterize_MODEL, which must align with |
samples | Number of samples generated in calculating quantiles. |
species | Species desired (either "Rat", "Rabbit", "Dog", "Mouse", ordefault "Human"). Species must be set to "Human" to run httkpop model. |
suppress.messages | Whether or not to suppress output message. |
model | Model used in calculation: 'pbtk' for the multiple compartmentmodel,'3compartment' for the three compartment model, '3compartmentss' forthe three compartment steady state model, and '1compartment' for onecompartment model. This only applies when httkpop=TRUE andspecies="Human", otherwise '3compartmentss' is used. |
httkpop | Whether or not to use population generator and sampler fromhttkpop. This is overwrites censored.params and vary.params and is onlyfor human physiology. Species must also be set to 'Human'. |
httkpop.dt | A data table generated by |
invitrouv | Logical to indicate whether to include in vitro parametersin uncertainty and variability analysis |
calcrb2p | Logical determining whether or not to recalculate thechemical ratio of blood to plasma |
censored.params | The parameters listed in censored.params are sampledfrom a normal distribution that is censored for values less than the limitof detection (specified separately for each parameter). This argumentshould be a list of sub-lists. Each sublist is named for a parameter in"parameters" and contains two elements: "CV" (coefficient of variation) and"LOD" (limit of detection, below which parameter values are censored. Newvalues are sampled with mean equal to the value in "parameters" andstandard deviation equal to the mean times the CV. Censored values aresampled on a uniform distribution between 0 and the limit of detection. Notused with httkpop model. |
vary.params | The parameters listed in vary.params are sampled from anormal distribution that is truncated at zero. This argument should be alist of coefficients of variation (CV) for the normal distribution. Eachentry in the list is named for a parameter in "parameters". New values aresampled with mean equal to the value in "parameters" and standard deviationequal to the mean times the CV. Not used with httkpop model. |
return.samples | Whether or not to return the vector containing thesamples from the simulation instead of the selected quantile. |
tissue | Desired steady state tissue conentration. |
output.units | Plasma concentration units, either uM or default mg/L. |
solvemodel.arg.list | Additional arguments ultimately passed to |
Caco2.options | A list of options to use when working with Caco2 apicalto basolateral data |
invitro.mc.arg.list | List of additional parameters passed to |
httkpop.generate.arg.list | Additional parameters passed to |
convert.httkpop.arg.list | Additional parameters passed to theconvert_httkpop_* function for the model. |
parameterize.args.list | Additional parameters passed to theparameterize_* function for the model. |
propagate.invitrouv.arg.list | List of additional parameters passed to |
return.all.sims | Logical indicating whether to return the results ofall simulations, in addition to the default toxicokinetic statistics |
Details
The Monte Carlo methods used here were recently updated and described byBreen et al. (submitted).
All arguments after httkpop only apply if httkpop is set to TRUE and speciesto "Human".
When species is specified as rabbit, dog, or mouse, the function uses theappropriate physiological data(volumes and flows) but substitutes humanfraction unbound, partition coefficients, and intrinsic hepatic clearance.
The six sets of plausiblein vitro-in vivo extrapolation (IVIVE)assumptions identified by Honda et al. (2019)(doi:10.1371/journal.pone.0217564)are:
| in vivo Conc. | Metabolic Clearance | Bioactive ChemicalConc. | TK Statistic Used | |
| Honda1 | Veinous (Plasma) | Restrictive | Free | Mean Conc. |
| Honda2 | Veinous | Restrictive | Free | Max Conc. |
| Honda3 | Veinous | Non-restrictive | Total | Mean Conc. |
| Honda4 | Veinous | Non-restrictive | Total | Max Conc. |
| Honda5 | Target Tissue | Non-restrictive | Total | Mean Conc. |
| Honda6 | Target Tissue | Non-restrictive | Total | Max Conc. |
NOTE: This function, and [create_mc_samples()], calculate oralbioavailability parameters based on Caco2 data. If you are comparing theoutput of this function to the output of [solve_model()], you will need to toensure that [solve_model()] also uses Caco2 data, rather than its defaultbehavior of using *in vivo* oral bioavailability data when available. To dothat, please pass the following argument to [solve_model()]: 'Caco2.options =list(overwrite.invivo = TRUE'.
Value
If return.all.sims == FALSE (default) a list with:
means | The mean concentration for each model compartment as a functionof time across the Monte Carlo simulation |
sds | The standard deviation for each model compartment as a functionof time across the Monte Carlo simulation |
If return.all.sums == TRUE then a list is returned with:
stats | Thelist of means and sds from return.all.sums=FALSE |
sims | The concentration vs. time results for each compartment forevery (samples) set of parameters in the Monte Carlo simulation |
Author(s)
John Wambaugh
See Also
Examples
NSAMP <- 50chemname="Abamectin"times<- c(0,0.25,0.5,0.75,1,1.5,2,2.5,3,4,5)age.ranges <- seq(6,80,by=10)forward <- NULLfor (age.lower in age.ranges){ label <- paste("Ages ",age.lower,"-",age.lower+4,sep="") set.seed(1234) forward[[label]] <- calc_mc_tk( chem.name=chemname, samples=NSAMP, httkpop.generate.arg.list=list( method="d", agelim_years = c(age.lower, age.lower+9)), solvemodel.arg.list = list( times=times))}set.seed(1234)# well-behaved chemical with a measured Rblood2plasma:lapply(calc_mc_tk(chem.cas="80-05-7",samples=NSAMP),function(x) x[-2,])Calculate the constant ratio of the blood concentration to the plasmaconcentration.
Description
This function calculates the constant ratio of the blood concentration tothe plasma concentration.
Usage
calc_rblood2plasma( chem.cas = NULL, chem.name = NULL, dtxsid = NULL, parameters = NULL, hematocrit = NULL, Krbc2pu = NULL, Funbound.plasma = NULL, default.to.human = FALSE, species = "Human", adjusted.Funbound.plasma = TRUE, class.exclude = TRUE, suppress.messages = TRUE)Arguments
chem.cas | Either the CAS number or the chemical name must bespecified. |
chem.name | Either the chemical name or the CAS number must bespecified. |
dtxsid | EPA's DSSTox Structure ID (https://comptox.epa.gov/dashboard)the chemical must be identified by either CAS, name, or DTXSIDs |
parameters | Parameters from |
hematocrit | Overwrites default hematocrit value in calculatingRblood2plasma. |
Krbc2pu | The red blood cell to unbound plasma chemical partitioncoefficient, typically from |
Funbound.plasma | The fraction of chemical unbound (free) in thepresence of plasma protein |
default.to.human | Substitutes missing animal values with human valuesif true. |
species | Species desired (either "Rat", "Rabbit", "Dog", "Mouse", ordefault "Human"). |
adjusted.Funbound.plasma | Whether or not to use Funbound.plasmaadjustment. |
class.exclude | Exclude chemical classes identified as outside of domain of applicability by relevant modelinfo_[MODEL] file (default TRUE). |
suppress.messages | Determine whether to display certain usagefeedback. |
Details
The red blood cell (RBC) parition coefficient as predicted by the Schmitt(2008) method is used in the calculation. The value is calculated with theequation: 1 - hematocrit + hematocrit * Krbc2pu * Funbound.plasma, summingthe red blood cell to plasma and plasma:plasma (equal to 1) partitioncoefficients multiplied by their respective fractional volumes. Whenspecies is specified as rabbit, dog, or mouse, the function uses theappropriate physiological data (hematocrit and temperature), but substituteshuman fraction unbound and tissue volumes.
Value
The blood to plasma chemical concentration ratio
Author(s)
John Wambaugh and Robert Pearce
References
Schmitt W (2008).“General approach for the calculation of tissue to plasma partition coefficients.”Toxicology in vitro,22(2), 457–467.doi:10.1016/j.tiv.2007.09.010.
Pearce RG, Setzer RW, Davis JL, Wambaugh JF (2017).“Evaluation and calibration of high-throughput predictions of chemical distribution to tissues.”Journal of pharmacokinetics and pharmacodynamics,44, 549–565.doi:10.1007/s10928-017-9548-7.
Ruark CD, Hack CE, Robinson PJ, Mahle DA, Gearhart JM (2014).“Predicting passive and active tissue: plasma partition coefficients: interindividual and interspecies variability.”Journal of pharmaceutical sciences,103(7), 2189–2198.doi:10.1002/jps.24011.
Examples
calc_rblood2plasma(chem.name="Bisphenol A")calc_rblood2plasma(chem.name="Bisphenol A",species="Rat")Calculate toxicokinetic summary statistics (deprecated).
Description
#' This function is included for backward compatibility. It callscalc_tkstats which calculates the area under the curve, the mean, and the peak valuesfor the venous blood or plasma concentration of a specified chemical or allchemicals if none is specified for the multiple compartment model with agiven number of days, dose, and number of doses per day.
Usage
calc_stats( chem.name = NULL, chem.cas = NULL, dtxsid = NULL, parameters = NULL, route = "oral", stats = c("AUC", "peak", "mean"), species = "Human", days = 28, daily.dose = 1, dose = NULL, doses.per.day = 1, output.units = "uM", concentration = "plasma", tissue = "plasma", model = "pbtk", default.to.human = FALSE, adjusted.Funbound.plasma = TRUE, regression = TRUE, restrictive.clearance = TRUE, suppress.messages = FALSE, ...)Arguments
chem.name | Name of desired chemical. |
chem.cas | CAS number of desired chemical. |
dtxsid | EPA's DSSTox Structure ID (https://comptox.epa.gov/dashboard)the chemical must be identified by either CAS, name, or DTXSIDs |
parameters | Chemical parameters from parameterize_pbtk function,overrides chem.name and chem.cas. |
route | String specification of route of exposure for simulation:"oral", "iv", "inhalation", ... |
stats | Desired values (either 'AUC', 'mean', 'peak', or a vectorcontaining any combination). |
species | Species desired (either "Rat", "Rabbit", "Dog", "Mouse", ordefault "Human"). |
days | Length of the simulation. |
daily.dose | Total daily dose, mg/kg BW. |
dose | Amount of a single dose at time zero, mg/kg BW. |
doses.per.day | Number of doses per day. |
output.units | Desired units (either "mg/L", "mg", "umol", or default"uM"). |
concentration | Desired concentration type, 'blood' or default'plasma'. |
tissue | Desired steady state tissue conentration. |
model | Model used in calculation, 'pbtk' for the multiple compartmentmodel,'3compartment' for the three compartment model, '3compartmentss' forthe three compartment steady state model, and '1compartment' for onecompartment model. |
default.to.human | Substitutes missing animal values with human valuesif true (hepatic intrinsic clearance or fraction of unbound plasma). |
adjusted.Funbound.plasma | Uses adjusted Funbound.plasma when set toTRUE along with partition coefficients calculated with this value. |
regression | Whether or not to use the regressions in calculatingpartition coefficients. |
restrictive.clearance | Protein binding not taken into account (set to1) in liver clearance if FALSE. |
suppress.messages | Whether to suppress output message. |
... | Arguments passed to solve function. |
Details
Default value of 0 for doses.per.day solves for a single dose.
When species is specified as rabbit, dog, or mouse, the function uses theappropriate physiological data(volumes and flows) but substitues humanfraction unbound, partition coefficients, and intrinsic hepatic clearance.
Value
AUC | Area under the plasma concentration curve. |
mean.conc | The area under the curve divided by the number of days. |
peak.conc | The highest concentration. |
Author(s)
Robert Pearce and John Wambaugh
Calculate toxicokinetic summary statistics.
Description
This function calculates the area under the curve, the mean, and the peak valuesfor the venous blood or plasma concentration of a specified chemical or allchemicals if none is specified for the multiple compartment model with agiven number of days, dose, and number of doses per day.
Usage
calc_tkstats( chem.name = NULL, chem.cas = NULL, dtxsid = NULL, parameters = NULL, route = "oral", stats = c("AUC", "peak", "mean"), species = "Human", days = 28, daily.dose = 1, dose = NULL, forcings = NULL, doses.per.day = 1, output.units = "uM", concentration = "plasma", tissue = "plasma", model = "pbtk", suppress.messages = FALSE, ...)Arguments
chem.name | Name of desired chemical. |
chem.cas | CAS number of desired chemical. |
dtxsid | EPA's DSSTox Structure ID (https://comptox.epa.gov/dashboard)the chemical must be identified by either CAS, name, or DTXSIDs |
parameters | Chemical parameters from parameterize_pbtk function,overrides chem.name and chem.cas. |
route | String specification of route of exposure for simulation:"oral", "iv", "inhalation", ... |
stats | Desired values (either 'AUC', 'mean', 'peak', or a vectorcontaining any combination). |
species | Species desired (either "Rat", "Rabbit", "Dog", "Mouse", ordefault "Human"). |
days | Length of the simulation. |
daily.dose | Total daily dose, mg/kg BW. |
dose | Amount of a single dose at time zero, mg/kg BW. |
forcings | Manual input of 'forcings' data series argument for odeintegrator, defaults is NULL. Then other input parameters(see exp.start.time, exp.conc, exp.duration, and period) provide thenecessary information to assemble a forcings data series. |
doses.per.day | Number of doses per day. |
output.units | Desired units (either "mg/L", "mg", "umol", or default"uM"). |
concentration | Desired concentration type, 'blood' or default'plasma'. |
tissue | Desired steady state tissue conentration. |
model | Model used in calculation, 'pbtk' for the multiple compartmentmodel,'3compartment' for the three compartment model, '3compartmentss' forthe three compartment steady state model, and '1compartment' for onecompartment model. |
suppress.messages | Whether to suppress output message. |
... | Additional arguments passed to the |
Details
Default value of 0 for doses.per.day solves for a single dose.
When species is specified as rabbit, dog, or mouse, the function uses theappropriate physiological data(volumes and flows) but substitues humanfraction unbound, partition coefficients, and intrinsic hepatic clearance.
Value
AUC | Area under the plasma concentration curve. |
mean.conc | The area under the curve divided by the number of days. |
peak.conc | The highest concentration. |
Author(s)
Robert Pearce and John Wambaugh
Examples
calc_tkstats(chem.name='Bisphenol-A',days=100,stats='mean',model='3compartment')calc_tkstats(chem.name='Bisphenol-A',days=100,stats=c('peak','mean'),species='Rat')triclosan.stats <- calc_tkstats(days=10, chem.name = "triclosan")calc_tkstats(dtxsid="DTXSID0020442",days=1)calc_tkstats(dtxsid="DTXSID0020442",days=10)calc_tkstats(dtxsid="DTXSID0020442",days=100)Calculate the total plasma clearance.
Description
This function calculates the total clearance rate for a one compartment modelfor plasmawhere clearance is entirely due to metablism by the liver and glomerularfiltration in the kidneys, identical to clearance of three compartmentsteady state model.
Usage
calc_total_clearance( chem.cas = NULL, chem.name = NULL, dtxsid = NULL, parameters = NULL, model = "3compartmentss", suppress.messages = FALSE, species = "Human", ...)Arguments
chem.cas | Either the chemical name, CAS number, or the parameters mustbe specified. |
chem.name | Either the chemical name, CAS number, or the parametersmust be specified. |
dtxsid | EPA's 'DSSTox Structure ID (https://comptox.epa.gov/dashboard)the chemical must be identified by either CAS, name, or DTXSIDs |
parameters | Chemical parameters from parameterize_steadystatefunction, overrides chem.name and chem.cas. |
model | The model used to calculate total clearance (defaults to "3compartmentss") |
suppress.messages | Whether or not the output message is suppressed. |
species | Species desired (either "Rat", "Rabbit", "Dog", "Mouse", ordefault "Human"). |
... | Additional parameters passed to parameterize function if parameters is NULL. |
Value
Total Clearance | Units of L/h/kg BW. |
Author(s)
John Wambaugh
Examples
calc_total_clearance(chem.name="Ibuprofen")Calculate the volume of distribution for a one compartment model.
Description
This function predicts partition coefficients for all tissues usingpredict_partitioning_schmitt, then lumps theminto a single compartment.
Usage
calc_vdist( chem.cas = NULL, chem.name = NULL, dtxsid = NULL, parameters = NULL, suppress.messages = FALSE, adjusted.Funbound.plasma = TRUE, species = "Human", default.to.human = FALSE, ...)Arguments
chem.cas | Either the CAS number or the chemical name must be specifiedwhen Funbound.plasma is not given in parameter list. |
chem.name | Either the chemical name or the CAS number must bespecified when Funbound.plasma is not given in parameter list. |
dtxsid | EPA's DSSTox Structure ID (https://comptox.epa.gov/dashboard)the chemical must be identified by either CAS, name, or DTXSIDs |
parameters | Parameters from parameterize_3comp, parameterize_pbtk orpredict_partitioning_schmitt. |
suppress.messages | Whether or not the output message is suppressed. |
adjusted.Funbound.plasma | Uses Pearce et al. (2017) lipid binding adjustmentfor Funbound.plasma (which impacts partition coefficients) when set to TRUE (Default). |
species | Species desired (either "Rat", "Rabbit", "Dog", "Mouse", ordefault "Human"). |
default.to.human | Substitutes missing animal values with human valuesif true. |
... | Additional parameters passed to parameterize function if parameters is NULL. |
Details
The effective volume of distribution is calculated by summing each tissuesvolume times it's partition coefficient relative to plasma. Plasma, and theparitioning into RBCs are also added to get the total volume of distributionin L/KG BW. Partition coefficients are calculated using Schmitt's (2008)method. When species is specified as rabbit, dog, or mouse, the functionuses the appropriate physiological data(volumes and flows) but substitueshuman fraction unbound, partition coefficients, and intrinsic hepaticclearance.
Value
Volume of distribution | Units of L/ kg BW. |
Author(s)
John Wambaugh and Robert Pearce
References
Schmitt W (2008).“General approach for the calculation of tissue to plasma partition coefficients.”Toxicology in vitro,22(2), 457–467.doi:10.1016/j.tiv.2007.09.010.
Peyret T, Poulin P, Krishnan K (2010).“A unified algorithm for predicting partition coefficients for PBPK modeling of drugs and environmental chemicals.”Toxicology and applied pharmacology,249(3), 197–207.doi:10.1016/j.taap.2010.09.010.
See Also
Examples
calc_vdist(chem.cas="80-05-7")calc_vdist(chem.name="Bisphenol A")calc_vdist(chem.name="Bisphenol A",species="Rat")# Create a list of parameters (that you can potentially change):p <- parameterize_schmitt(chem.name="propranolol")# Need to use those parameters to predict partition coefficients:PCs <- predict_partitioning_schmitt(parameters = p)# Lump the tissues into a single volume of distributioncalc_vdist(parameters=c(p,PCs))# Should be the same as chemical by name:calc_vdist(chem.name="propranolol")# Different ways to give the arguments:calc_vdist(chem.cas="80-05-7")params <- parameterize_schmitt(chem.name="triclosan")params <- c(params, predict_partitioning_schmitt(parameters = params))calc_vdist(parameters=params)params <- parameterize_3comp(chem.name="triclosan")calc_vdist(parameters=params)params <- parameterize_pbtk(chem.name="triclosan")calc_vdist(parameters=params)CAS number format check function
Description
This function checks whether the CAS/CARN chemical identifier follows the anticipatedformat of XXXXXXX-YY-Z (i.e. 2-7 digits, 2 digits, and 1 digit, respectively).
Usage
cas_id_check(cas)Arguments
cas | A character string, or vector of character strings, indicatingCAS/CASRN number. |
Value
Logical output (TRUE or FALSE) indicating whether the character string(s)provided match the anticipated format for a CAS/CASRN chemical identifier.
Check for sufficient model parameters
Description
This function halt model evaluation if not all the needed parameters(as specified in the modelinfo_[MODEL].r file) are available. The function usesget_cheminfo, so if the chemical has been checked against thatfunction already then evaluation should proceed as expected. If you do nothave the parameters you need and are using a non-humanspecies try default.to.human = TRUE (there are many more values for human thanany other species). If working in human, try first usingload_dawson2021,load_sipes2017, orload_pradeep2020.
Usage
check_model( chem.name = NULL, chem.cas = NULL, dtxsid = NULL, model = NULL, species = NULL, class.exclude = TRUE, physchem.exclude = TRUE, default.to.human = FALSE)Arguments
chem.name | Chemical name (spaces and capitalization ignored) – ifparameters is not specified then the chemical must be identified by eitherCAS, name, or DTXISD |
chem.cas | Chemical Abstract Services Registry Number (CAS-RN) – ifparameters is not specified then the chemical must be identified by eitherCAS, name, or DTXISD |
dtxsid | EPA's DSSTox Structure ID (https://comptox.epa.gov/dashboard)– if parameters is not specified then the chemical must be identified by either CAS, name, or DTXSIDs |
model | Model to be checked, modelinfo files specify the requrements of each model. |
species | Species desired (either "Rat", "Rabbit", "Dog", "Mouse", ordefault "Human"). |
class.exclude | Exclude chemical classes identified as outside of domain of applicability by relevant modelinfo_[MODEL] file (default TRUE). |
physchem.exclude | Exclude chemicals on the basis of physico-chemicalproperties (currently only Henry's law constant) as specified by the relevant modelinfo_[MODEL] file (default TRUE). |
default.to.human | Substitutes missing fraction of unbound plasma withhuman values if true. |
Value
Stops code from running if all parameters needed for modelare not available, otherwise does nothing.
Author(s)
john Wambaugh
See Also
Parameter Estimates from Wambaugh et al. (2018)
Description
This table includes 1 and 2 compartment fits of plasma concentration vs timedata aggregated from chem.invivo.PK.data, performed in Wambaugh et al. 2018.Data includes volume of distribution (Vdist, L/kg), elimination rate (kelim,1/h), gut absorption rate (kgutabs, 1/h), fraction absorbed (Fabsgut), andsteady state concentration (Css, mg/L).
Usage
chem.invivo.PK.aggregate.dataFormat
data.frame
Author(s)
John Wambaugh
Source
Wambaugh et al. 2018
References
Wambaugh JF, Hughes MF, Ring CL, MacMillan DK, Ford J, Fennell TR, Black SR, Snyder RW, Sipes NS, Wetmore BA, others (2018).“Evaluating in vitro-in vivo extrapolation of toxicokinetics.”Toxicological Sciences,163(1), 152–169.doi:10.1093/toxsci/kfy020.
Summary of published toxicokinetic time course experiments
Description
This data set summarizes the time course data in the chem.invivo.PK.datatable. Maximum concentration (Cmax), time integrated plasma concentrationfor the duration of treatment (AUC.treatment) and extrapolated to zeroconcentration (AUC.infinity) as well as half-life are calculated. Summaryvalues are given for each study and dosage. These data can be used toevaluate toxicokinetic model predictions.
Usage
chem.invivo.PK.summary.dataFormat
A data.frame containing 100 rows and 25 columns.
Author(s)
John Wambaugh
Source
Wambaugh et al. 2018 Toxicological Sciences, in press
References
Aanderud L, Bakke OM (1983). Pharmacokinetics of antipyrine,paracetamol, and morphine in rat at 71 ATA. Undersea Biomed Res.10(3):193-201. PMID: 6636344
Aasmoe L, Mathiesen M, Sager G (1999). Elimination of methoxyacetic acid andethoxyacetic acid in rat. Xenobiotica. 29(4):417-24. PMID: 10375010
Ako RA. Pharmacokinetics/pharmacodynamics (PK/PD) of oral diethylstilbestrol(DES) in recurrent prostate cancer patients and of oral dissolving film(ODF)-DES in rats. PhD dissertation, College of Pharmacy, University ofHouston, USA, 2011.
Anadon A, Martinez-Larranaga MR, Fernandez-Cruz ML, Diaz MJ, Fernandez MC,Martinez MA (1996). Toxicokinetics of deltamethrin and its 4'-HO-metabolitein the rat. Toxicol Appl Pharmacol. 141(1):8-16. PMID: 8917670
Binkerd PE, Rowland JM, Nau H, Hendrickx AG (1988). Evaluation of valproicacid (VPA) developmental toxicity and pharmacokinetics in Sprague-Dawleyrats. Fundam Appl Toxicol. 11(3):485-93. PMID: 3146521
Boralli VB, Coelho EB, Cerqueira PM, Lanchote VL (2005). Stereoselectiveanalysis of metoprolol and its metabolites in rat plasma with application tooxidative metabolism. J Chromatogr B Analyt Technol Biomed Life Sci.823(2):195-202. PMID: 16029965
Chan MP, Morisawa S, Nakayama A, Kawamoto Y, Sugimoto M, Yoneda M (2005).Toxicokinetics of 14C-endosulfan in male Sprague-Dawley rats following oraladministration of single or repeated doses. Environ Toxicol. 20(5):533-41.PMID: 16161119
Cruz L, Castaneda-Hernandez G, Flores-Murrieta FJ, Garcia-Lopez P,Guizar-Sahagun G (2002). Alteration of phenacetin pharmacokinetics afterexperimental spinal cord injury. Proc West Pharmacol Soc. 45:4-5. PMID:12434508
Della Paschoa OE, Mandema JW, Voskuyl RA, Danhof M (1998).Pharmacokinetic-pharmacodynamic modeling of the anticonvulsant andelectroencephalogram effects of phenytoin in rats. J Pharmacol Exp Ther.284(2):460-6. PMID: 9454785
Du B, Li X, Yu Q, A Y, Chen C (2010). Pharmacokinetic comparison of orallydisintegrating, beta-cyclodextrin inclusion complex and conventional tabletsof nicardipine in rats. Life Sci J. 7(2):80-4.
Farris FF, Dedrick RL, Allen PV, Smith JC (1993). Physiological model forthe pharmacokinetics of methyl mercury in the growing rat. Toxicol ApplPharmacol. 119(1):74-90. PMID: 8470126
Hays SM, Elswick BA, Blumenthal GM, Welsch F, Conolly RB, Gargas ML (2000).Development of a physiologically based pharmacokinetic model of2-methoxyethanol and 2-methoxyacetic acid disposition in pregnant rats.Toxicol Appl Pharmacol. 163(1):67-74. PMID: 10662606
Igari Y, Sugiyama Y, Awazu S, Hanano M (1982). Comparative physiologicallybased pharmacokinetics of hexobarbital, phenobarbital and thiopental in therat. J Pharmacokinet Biopharm. 10(1):53-75. PMID: 7069578
Ito K, Houston JB (2004). Comparison of the use of liver models forpredicting drug clearance using in vitro kinetic data from hepaticmicrosomes and isolated hepatocytes. Pharm Res. 21(5):785-92. PMID: 15180335
Jia L, Wong H, Wang Y, Garza M, Weitman SD (2003). Carbendazim: disposition,cellular permeability, metabolite identification, and pharmacokineticcomparison with its nanoparticle. J Pharm Sci. 92(1):161-72. PMID: 12486692
Kawai R, Mathew D, Tanaka C, Rowland M (1998). Physiologically basedpharmacokinetics of cyclosporine A: extension to tissue distributionkinetics in rats and scale-up to human. J Pharmacol Exp Ther. 287(2):457-68.PMID: 9808668
Kim YC, Kang HE, Lee MG (2008). Pharmacokinetics of phenytoin and itsmetabolite, 4'-HPPH, after intravenous and oral administration of phenytointo diabetic rats induced by alloxan or streptozotocin. Biopharm Drug Dispos.29(1):51-61. PMID: 18022993
Kobayashi S, Takai K, Iga T, Hanano M (1991). Pharmacokinetic analysis ofthe disposition of valproate in pregnant rats. Drug Metab Dispos.19(5):972-6. PMID: 1686245
Kotegawa T, Laurijssens BE, Von Moltke LL, Cotreau MM, Perloff MD,Venkatakrishnan K, Warrington JS, Granda BW, Harmatz JS, Greenblatt DJ(2002). In vitro, pharmacokinetic, and pharmacodynamic interactions ofketoconazole and midazolam in the rat. J Pharmacol Exp Ther. 302(3):1228-37.PMID: 12183684
Krug AK, Kolde R, Gaspar JA, Rempel E, Balmer NV, Meganathan K, Vojnits K,Baquie M, Waldmann T, Ensenat-Waser R, Jagtap S, Evans RM, Julien S,Peterson H, Zagoura D, Kadereit S, Gerhard D, Sotiriadou I, Heke M,Natarajan K, Henry M, Winkler J, Marchan R, Stoppini L, Bosgra S, WesterhoutJ, Verwei M, Vilo J, Kortenkamp A, Hescheler J, Hothorn L, Bremer S, vanThriel C, Krause KH, Hengstler JG, Rahnenfuhrer J, Leist M, Sachinidis A(2013). Human embryonic stem cell-derived test systems for developmentalneurotoxicity: a transcriptomics approach. Arch Toxicol. 87(1):123-43. PMID:23179753
Leon-Reyes MR, Castaneda-Hernandez G, Ortiz MI (2009). Pharmacokinetic ofdiclofenac in the presence and absence of glibenclamide in the rat. J PharmPharm Sci. 12(3):280-7. PMID: 20067705
Nagata M, Hidaka M, Sekiya H, Kawano Y, Yamasaki K, Okumura M, Arimori K(2007). Effects of pomegranate juice on human cytochrome P450 2C9 andtolbutamide pharmacokinetics in rats. Drug Metab Dispos. 35(2):302-5. PMID:17132763
Okiyama M, Ueno K, Ohmori S, Igarashi T, Kitagawa H (1988). Druginteractions between imipramine and benzodiazepines in rats. J Pharm Sci.77(1):56-63. PMID: 2894451
Pelissier-Alicot AL, Schreiber-Deturmeny E, Simon N, Gantenbein M,Bruguerolle B (2002). Time-of-day dependent pharmacodynamic andpharmacokinetic profiles of caffeine in rats. Naunyn Schmiedebergs ArchPharmacol. 365(4):318-25. PMID: 11919657
Piersma AH, Bosgra S, van Duursen MB, Hermsen SA, Jonker LR, Kroese ED, vander Linden SC, Man H, Roelofs MJ, Schulpen SH, Schwarz M, Uibel F, vanVugt-Lussenburg BM, Westerhout J, Wolterbeek AP, van der Burg B (2013).Evaluation of an alternative in vitro test battery for detectingreproductive toxicants. Reprod Toxicol. 38:53-64. PMID: 23511061
Pollack GM, Li RC, Ermer JC, Shen DD (1985). Effects of route ofadministration and repetitive dosing on the disposition kinetics ofdi(2-ethylhexyl) phthalate and its mono-de-esterified metabolite in rats.Toxicol Appl Pharmacol. Jun 30;79(2):246-56. PMID: 4002226
Saadeddin A, Torres-Molina F, Carcel-Trullols J, Araico A, Peris JE (2004).Pharmacokinetics of the time-dependent elimination of all-trans-retinoicacid in rats. AAPS J. 6(1):1-9. PMID: 18465253
Satterwhite JH, Boudinot FD (1991). Effects of age and dose on thepharmacokinetics of ibuprofen in the rat. Drug Metab Dispos. 19(1):61-7.PMID: 1673423
Szymura-Oleksiak J, Panas M, Chrusciel W (1983). Pharmacokinetics ofimipramine after single and multiple intravenous administration in rats. PolJ Pharmacol Pharm. 35(2):151-7. PMID: 6622297
Tanaka C, Kawai R, Rowland M (2000). Dose-dependent pharmacokinetics ofcyclosporin A in rats: events in tissues. Drug Metab Dispos. 28(5):582-9.PMID: 10772639
Timchalk C, Nolan RJ, Mendrala AL, Dittenber DA, Brzak KA, Mattsson JL(2002). A Physiologically based pharmacokinetic and pharmacodynamic(PBPK/PD) model for the organophosphate insecticide chlorpyrifos in rats andhumans. Toxicol Sci. Mar;66(1):34-53. PMID: 11861971
Tokuma Y, Sekiguchi M, Niwa T, Noguchi H (1988). Pharmacokinetics ofnilvadipine, a new dihydropyridine calcium antagonist, in mice, rats,rabbits and dogs. Xenobiotica 18(1):21-8. PMID: 3354229
Treiber A, Schneiter R, Delahaye S, Clozel M (2004). Inhibition of organicanion transporting polypeptide-mediated hepatic uptake is the majordeterminant in the pharmacokinetic interaction between bosentan andcyclosporin A in the rat. J Pharmacol Exp Ther. 308(3):1121-9. PMID:14617681
Tsui BC, Feng JD, Buckley SJ, Yeung PK (1994). Pharmacokinetics andmetabolism of diltiazem in rats following a single intra-arterial or singleoral dose. Eur J Drug Metab Pharmacokinet. 19(4):369-73. PMID: 7737239
Wambaugh, John F., et al. "Toxicokinetic triage for environmentalchemicals." Toxicological Sciences (2015): 228-237.
Wang Y, Roy A, Sun L, Lau CE (1999). A double-peak phenomenon in thepharmacokinetics of alprazolam after oral administration. Drug Metab Dispos.27(8):855-9. PMID: 10421610
Wang X, Lee WY, Or PM, Yeung JH (2010). Pharmacokinetic interaction studiesof tanshinones with tolbutamide, a model CYP2C11 probe substrate, usingliver microsomes, primary hepatocytes and in vivo in the rat. Phytomedicine.17(3-4):203-11. PMID: 19679455
Yang SH, Lee MG (2008). Dose-independent pharmacokinetics of ondansetron inrats: contribution of hepatic and intestinal first-pass effects to lowbioavailability. Biopharm Drug Dispos. 29(7):414-26. PMID: 18697186
Yeung PK, Alcos A, Tang J (2009). Pharmacokinetics and Hemodynamic Effectsof Diltiazem in Rats Following Single vs Multiple Doses In Vivo. Open DrugMetab J. 3:56-62.
Physico-chemical properties and in vitro measurements for toxicokinetics
Description
This data set contains the necessary information to make basic,high-throughput toxicokinetic (HTTK) predictions for compounds, includingFunbound.plasma, molecular weight (g/mol), logP, logMA (membrane affinity),intrinsic clearance(uL/min/10^6 cells), and pKa. These data have beencompiled from multiple sources, and can be used to parameterize a variety oftoxicokinetic models. See variable EPA.ref for information on the reference EPA.
Usage
chem.physical_and_invitro.dataFormat
A data.frame containing 9411 rows and 54 columns.
| Column Name | Description | Units |
| Compound | The preferred name of the chemical compound | none |
| CAS | The preferred Chemical Abstracts Service Registry Number | none |
| CAS.Checksum | A logical indicating whether the CAS number is valid | none |
| DTXSID | DSSTox Structure ID (https://comptox.epa.gov/dashboard) | none |
| Formula | The proportions of atoms within the chemical compound | none |
| All.Compound.Names | All names of the chemical as they occured in thedata | none |
| logHenry | The log10 Henry's law constant (Conc_air = 10^logH * Conc_liquid) | log10(atmosphers*m^3/mole) |
| logHenry.Reference | Reference for Henry's law constant | |
| logP | The log10 octanol:water partition coefficient (PC) | log10 unitless ratio |
| logP.Reference | Reference for logPow | |
| logPwa | The log10 water:air PC | log10 unitless ratio |
| logPwa.Reference | Reference for logPwa | |
| logMA | The log10 phospholipid:water PC or"Membrane affinity" | unitless ratio |
| logMA.Reference | Reference for membrane affinity | |
| logWSol | The log10 water solubility | log10(mole/L) |
| logWSol.Reference | Reference for logWsol | |
| MP | The chemical compound melting point | degrees Celsius |
| MP.Reference | Reference for melting point | |
| MW | The chemical compound molecular weight | g/mol |
| MW.Reference | Reference for molecular weight | |
| pKa_Accept | The hydrogen acceptor equilibria concentrations | logarithm |
| pKa_Accept.Reference | Reference for pKa_Accept | |
| pKa_Donor | The hydrogen acceptor equilibria concentrations | logarithm |
| pKa_Donor.Reference | Reference for pKa_Donor | |
| All.Species | All species for which data were available | none |
| DTXSID.Reference | Reference for DTXSID | |
| Formula.Reference | Reference for chemical formulat | |
| [SPECIES].Clint | (Primary hepatocyte suspension) intrinsic hepatic clearance.Entries with comma separated values are Bayesian estimates ofthe Clint distribution - displayed as the median, 95th credible interval(that is quantile 2.5 and 97.5, respectively), and p-value. | uL/min/10^6 hepatocytes |
| [SPECIES].Clint.pValue | Probability that there is no clearance observed. Values close to 1 indicate clearance is not statistically significant. | none |
| [SPECIES].Clint.pValue.Ref | Reference for Clint pValue | |
| [SPECIES].Clint.Reference | Reference for Clint | |
| [SPECIES].Caco2.Pab | Caco-2 Apical-to-Basal Membrane Permeability | 10^-6 cm/s |
| [SPECIES].Caco2.Pab.Reference | Reference for Caco-2 Membrane Permeability | |
| [SPECIES].Fabs | In vivo measured fraction of an oral dose of chemical absorbed from the gut lumen into the gut | unitless fraction |
| [SPECIES].Fabs.Reference | Reference for Fabs | |
| [SPECIES].Fgut | In vivo measured fraction of an oral dose of chemical that passes gut metabolism and clearance | unitless fraction |
| [SPECIES].Fgut.Reference | Reference for Fgut | |
| [SPECIES].Foral | In vivo measued fractional systemic bioavailability of an oral dose, modeled as he product of Fabs * Fgut * Fhep (where Fhep is first pass hepatic metabolism). | unitless fraction |
| [SPECIES].Foral.Reference | Reference for Foral | |
| [SPECIES].Funbound.plasma | Chemical fraction unbound in presence of plasma proteins (fup).Entries with comma separated values are Bayesian estimates ofthe fup distribution - displayed as the median and 95th credible interval(that is quantile 2.5 and 97.5, respectively). | unitless fraction |
| [SPECIES].Funbound.plasma.Ref | Reference for Funbound.plasma | |
| [SPECIES].Rblood2plasma | Chemical concentration blood to plasma ratio | unitless ratio |
| [SPECIES].Rblood2plasma.Ref | Reference for Rblood2plasma | |
| Chemical.Class | All classes to which the chemical has been assigned |
Details
In some cases the rapid equilbrium dailysis method (Waters et al., 2008)fails to yield detectable concentrations for the free fraction of chemical. In those cases we assume the compound is highly bound (that is, Fup approacheszero). For some calculations (for example, steady-state plasma concentration)there is precendent (Rotroff et al., 2010) for using half the average limit of detection, that is 0.005. We do not recomend using other models where quantities like partition coefficients must be predicted using Fup. We alsodo not recomend including the value 0.005 in training sets for Fup predictivemodels.
Note that in some cases theFunbound.plasma and theintrinsic clearance areprovided as a series of numbers separated by commas. These values are the result of Bayesian analysis and characterize a distribution: the first valueis the median of the distribution, while the second and third values are the lower and upper 95th percentile (that is qunatile 2.5 and 97.5) respectively.For intrinsic clearance a fourth value indicating a p-value for a decrease isprovided. Typically 4000 samples were used for the Bayesian analusis, suchthat a p-value of "0" is equivale to "<0.00025". See Wambaugh et al. (2019)for more details.
Any one chemical compoundmay have multiple ionization equilibria (see Strope et al., 2018) may both for donating or accepting a proton (andtherefore changing charge state). If there are multiple equlibria of the sametype (donor/accept])the are concatonated by commas.
All species-specific information is initially from experimental measurements.The functionsload_sipes2017,load_pradeep2020, andload_dawson2021 may be used to add in silico, structure-basedpredictions for many thousands of additional compounds to this table.
Author(s)
John Wambaugh
Source
Wambaugh, John F., et al. "Toxicokinetic triage for environmentalchemicals." Toxicological Sciences (2015): 228-237.
References
CompTox Chemicals Dashboard (https://comptox.epa.gov/dashboard)
EPI Suite, https://www.epa.gov/opptintr/exposure/pubs/episuite.htm
Brown, Hayley S., Michael Griffin, and J. Brian Houston. "Evaluation of cryopreserved human hepatocytes as an alternative in vitro system to microsomes for the prediction of metabolic clearance." Drug metabolism and disposition 35.2 (2007): 293-301.
Gulden, Michael, et al. "Impact of protein binding on the availability and cytotoxic potency of organochlorine pesticides and chlorophenols in vitro." Toxicology 175.1-3 (2002): 201-213.
Hilal, S., Karickhoff, S. and Carreira, L. (1995). A rigorous test forSPARC's chemical reactivity models: Estimation of more than 4300 ionizationpKas. Quantitative Structure-Activity Relationships 14(4), 348-355.
Honda GS, Pearce RG, Pham LL, Setzer RW, Wetmore BA, Sipes NS, Gilbert J, Franz B, Thomas RS, Wambaugh JF (2019).“Using the concordance of in vitro and in vivo data to evaluate extrapolation assumptions.”PloS one,14(5), e0217564.doi:10.1371/journal.pone.0217564.
Ito K, Houston JB (2004).“Comparison of the use of liver models for predicting drug clearance using in vitro kinetic data from hepatic microsomes and isolated hepatocytes.”Pharmaceutical research,21, 785–792.doi:10.1023/B:PHAM.0000026429.12114.7d.
Jones, O. A., Voulvoulis, N. and Lester, J. N. (2002). Aquatic environmentalassessment of the top 25 English prescription pharmaceuticals. Waterresearch 36(20), 5013-22.
Jones, Barry C., et al. "An investigation into the prediction of in vivo clearance for a range of flavin-containing monooxygenase substrates." Drug metabolism and disposition 45.10 (2017): 1060-1067.
Lau, Y. Y., Sapidou, E., Cui, X., White, R. E. and Cheng, K. C. (2002).Development of a novel in vitro model to predict hepatic clearance usingfresh, cryopreserved, and sandwich-cultured hepatocytes. Drug Metabolism andDisposition 30(12), 1446-54.
Linakis MW, Sayre RR, Pearce RG, Sfeir MA, Sipes NS, Pangburn HA, Gearhart JM, Wambaugh JF (2020).“Development and evaluation of a high-throughput inhalation model for organic chemicals.”Journal of exposure science & environmental epidemiology,30(5), 866–877.doi:10.1038/s41370-020-0238-y.
Lombardo, F., Berellini, G., & Obach, R. S. (2018). Trend analysis of a database of intravenous pharmacokinetic parameters in humans for 1352 drug compounds. Drug Metabolism and Disposition, 46(11), 1466-1477.
McGinnity, D. F., Soars, M. G., Urbanowicz, R. A. and Riley, R. J. (2004).Evaluation of fresh and cryopreserved hepatocytes as in vitro drugmetabolism tools for the prediction of metabolic clearance. Drug Metabolismand Disposition 32(11), 1247-53, 10.1124/dmd.104.000026.
Naritomi, Y., Terashita, S., Kagayama, A. and Sugiyama, Y. (2003). Utilityof Hepatocytes in Predicting Drug Metabolism: Comparison of HepaticIntrinsic Clearance in Rats and Humans in Vivo and in Vitro. Drug Metabolismand Disposition 31(5), 580-588, 10.1124/dmd.31.5.580.
Obach, R. S. (1999). Prediction of human clearance of twenty-nine drugs fromhepatic microsomal intrinsic clearance data: An examination of in vitrohalf-life approach and nonspecific binding to microsomes. Drug Metabolismand Disposition 27(11), 1350-9.
Paini, Alicia; Cole, Thomas; Meinero, Maria; Carpi, Donatella; Deceuninck, Pierre; Macko, Peter; Palosaari, Taina; Sund, Jukka; Worth, Andrew; Whelan, Maurice (2020): EURL ECVAM in vitro hepatocyte clearance and blood plasma protein binding dataset for 77 chemicals. European Commission, Joint Research Centre (JRC) [Dataset] PID: https://data.europa.eu/89h/a2ff867f-db80-4acf-8e5c-e45502713bee
Paixao, P., Gouveia, L. F., & Morais, J. A. (2012). Prediction of the humanoral bioavailability by using in vitro and in silico drug related parametersin a physiologically based absorption model. International journal ofpharmaceutics, 429(1), 84-98.
Pirovano, Alessandra, et al. "QSARs for estimating intrinsic hepaticclearance of organic chemicals in humans." Environmental toxicology andpharmacology 42 (2016): 190-197.
Riley, Robert J., Dermot F. McGinnity, and Rupert P. Austin. "A unified model for predicting human hepatic, metabolic clearance from in vitro intrinsic clearance data in hepatocytes and microsomes." Drug Metabolism and Disposition 33.9 (2005): 1304-1311.
Schmitt W (2008).“General approach for the calculation of tissue to plasma partition coefficients.”Toxicology in vitro,22(2), 457–467.doi:10.1016/j.tiv.2007.09.010.
Shibata, Y., Takahashi, H., Chiba, M. and Ishii, Y. (2002). Prediction ofHepatic Clearance and Availability by Cryopreserved Human Hepatocytes: AnApplication of Serum Incubation Method. Drug Metabolism and Disposition30(8), 892-896, 10.1124/dmd.30.8.892.
Sohlenius-Sternbeck, Anna-Karin, et al. "Practical use of the regression offset approach for the prediction of in vivo intrinsic clearance from hepatocytes." Xenobiotica 42.9 (2012): 841-853.
Tonnelier, A., Coecke, S. and Zaldivar, J.-M. (2012). Screening of chemicalsfor human bioaccumulative potential with a physiologically basedtoxicokinetic model. Archives of Toxicology 86(3), 393-403,10.1007/s00204-011-0768-0.
Uchimura, Takahide, et al. "Prediction of human blood-to-plasma drugconcentration ratio." Biopharmaceutics & drug disposition 31.5-6 (2010):286-297.
Wambaugh JF, Wetmore BA, Ring CL, Nicolas CI, Pearce RG, Honda GS, Dinallo R, Angus D, Gilbert J, Sierra T, others (2019).“Assessing toxicokinetic uncertainty and variability in risk prioritization.”Toxicological Sciences,172(2), 235–251.doi:10.1093/toxsci/kfz205.
Wetmore BA, Wambaugh JF, Ferguson SS, Sochaski MA, Rotroff DM, Freeman K, Clewell III HJ, Dix DJ, Andersen ME, Houck KA, others (2012).“Integration of dosimetry, exposure, and high-throughput screening data in chemical toxicity assessment.”Toxicological Sciences,125(1), 157–174.doi:10.1093/toxsci/kfr254.
Wetmore BA, Wambaugh JF, Ferguson SS, Li L, Clewell III HJ, Judson RS, Freeman K, Bao W, Sochaski MA, Chu T, others (2013).“Relative impact of incorporating pharmacokinetics on predicting in vivo hazard and mode of action from high-throughput in vitro toxicity assays.”toxicological sciences,132(2), 327–346.doi:10.1093/toxsci/kft012.
Wetmore BA, Wambaugh JF, Allen B, Ferguson SS, Sochaski MA, Setzer RW, Houck KA, Strope CL, Cantwell K, Judson RS, others (2015).“Incorporating high-throughput exposure predictions with dosimetry-adjusted in vitro bioactivity to inform chemical toxicity testing.”Toxicological Sciences,148(1), 121–136.doi:10.1093/toxsci/kfv171.
F. L. Wood, J. B. Houston and D. Hallifax'Drug Metabolism and Disposition November 1, 2017, 45 (11) 1178-1188; DOI: https://doi.org/10.1124/dmd.117.077040
See Also
CKD-EPI equation for GFR.
Description
Predict GFR from serum creatinine, gender, and age.
Usage
ckd_epi_eq(scr, gender, reth, age_years, ckd_epi_race_coeff = FALSE)Arguments
scr | Vector of serum creatinine values in mg/dL. |
gender | Vector of genders (either 'Male' or 'Female'). |
reth | Vector of races/ethnicities. Not used unless ckd_epi_race_coeff is TRUE. |
age_years | Vector of ages in years. |
ckd_epi_race_coeff | Whether to use the "race coefficient" in the CKD-EPI equation. Default is FALSE. |
Details
From Levey AS, Stevens LA, Schmid CH, Zhang YL, Castro AF, Feldman HI, et al. A newequation to estimate glomerular filtration rate. Ann Intern Med 2009;150(9):604-612. doi:10.7326/0003-4819-150-9-200905050-00006
Value
Vector of GFR values in mL/min/1.73m^2.
Author(s)
Caroline Ring
References
Ring CL, Pearce RG, Setzer RW, Wetmore BA, Wambaugh JF (2017).“Identifying populations sensitive to environmental chemicals by simulating toxicokinetic variability.”Environment International,106, 105–118.doi:10.1016/j.envint.2017.06.004.
convert_solve_x
Description
This function is designed to convert compartment values estimated from oneof the HTTK models (e.g. "1compartment) using the solve_model function.It takes the HTTK model output matrix, model name, desired output units,and compound information to perform the conversion default model units touser specified units.
Usage
convert_solve_x( model.output.mat, model = NULL, output.units = NULL, MW = NULL, vol = NULL, chem.cas = NULL, chem.name = NULL, dtxsid = NULL, parameters = NULL, monitor.vars = NULL, suppress.messages = FALSE, verbose = FALSE, ...)Arguments
model.output.mat | Matrix of results from HTTK solve_model function. |
model | Specified model to use in simulation: "pbtk", "3compartment","3compartmentss", "1compartment", "schmitt", ... |
output.units | Output units of interest for the compiled components.Defaults to NULL, and will provide values in model units if unspecified. |
MW | Molecular weight of substance of interest in g/mole |
vol | Volume for the target tissue of interest in liters (L).NOTE: Volume should not be in units of per BW, i.e. "kg". |
chem.cas | Either the chemical name, CAS number, or the parameters mustbe specified. |
chem.name | Either the chemical name, CAS number, or the parametersmust be specified. |
dtxsid | EPA's DSSTox Structure ID .(https://comptox.epa.gov/dashboard) the chemical must be identified byeither CAS, name, or DTXSIDs. |
parameters | A set of model parameters, especially a set thatincludes MW (molecular weight) for our conversions. |
monitor.vars | A vector of character strings indicating the modelcomponent variables to retain in the conversion factor table(assuming suppress.messages == FALSE). It should also be noted this optiondoes NOT exclude columns from the input matrix provided in the'model.output.mat' parameter. (Default is NULL, i.e. conversion factors forall model components are included in the reporting matrix.) |
suppress.messages | Whether or not the output messages are suppressed.(Default is FALSE, i.e. show messages.) |
verbose | Whether or not to display the full conversion factor table.(Default is FALSE, i.e. only include rows where the conversion factor is 1.) |
... | Other parameters that can be passed to |
Details
The function can be used to convert all compartments to a single unit,only units for a single model compartment, or units for a set of modelcompartments.
More details on the unit conversion can be found in the documentation forconvert_units.
Value
'new.ouput.matrix' A matrix with a column for time (in days), eachcompartment, and the area under the curve (AUC) and a rowfor each time point. The compartment and AUC columns areconverted from model specified units to user specified units.
'output.units.vector' A vector of character strings providing themodel compartments and their corresponding units afterconvert_solve_x.
Author(s)
Sarah E. Davidson
See Also
convert_units
Examples
output.mat <- solve_1comp(dtxsid = "DTXSID0020573",days=1)new.output.mat <- convert_solve_x(output.units = "mg", model.output.mat = output.mat, model = "1compartment", dtxsid = "DTXSID0020573")convert_units
Description
This function is designed to accept input units, output units, and the molecular weight (MW) of a substance of interest to then use a table lookupto return a scaling factor that can be readily applied for the intendedconversion. It can also take chemical identifiers in the place of a specified molecular weight value to retrieve that value for its own use.
Usage
convert_units( input.units = NULL, output.units = NULL, MW = NULL, vol = NULL, chem.cas = NULL, chem.name = NULL, dtxsid = NULL, parameters = NULL, temp = 25, liquid.density = 1, state = "liquid")Arguments
input.units | Assigned input units of interest |
output.units | Desired output units |
MW | Molecular weight of substance of interest in g/mole |
vol | Volume for the target tissue of interest in liters (L).NOTE: Volume should not be in units of per BW, i.e. "kg". |
chem.cas | Either the chemical name, CAS number, or the parameters mustbe specified. |
chem.name | Either the chemical name, CAS number, or the parametersmust be specified. |
dtxsid | EPA's DSSTox Structure ID (https://comptox.epa.gov/dashboard) the chemical must be identified byeither CAS, name, or DTXSIDs |
parameters | A set of model parameters, especially a set thatincludes MW (molecular weight) for our conversions |
temp | Temperature for conversions (default = 25 degreees C) |
liquid.density | Density of the specified chemical in liquid state,numeric value, (default 1.0 g/mL). |
state | Chemical state (gas or default liquid). |
Details
If input or output units not contained in the table are queried,it gives a corresponding error message. It gives a warning message about thehandling of 'ppmv,' as the function is only set up to convert between ppmv and mass-based units (like mg/m3 or umol/L) in the context of ideal gases.
convert_units is not directly configured to accept and convert units basedon BW, like mg/kg. For this purpose, seescale_dosing.
The function supports a limited set of most relevant units acrosstoxicological models, currently including umol, uM, mg, mg/L, mg/m3 or umol/L), andin the context of gases assumed to be ideal, ppmv.
Andersen and Clewell's Rules of PBPK Modeling:
Check Your Units
Check Your Units
Check Mass Balance
Author(s)
Mark Sfeir, John Wambaugh, and Sarah E. Davidson
Examples
# MW BPA is 228.29 g/mol# 1 mg/L -> 1/228.29*1000 = 4.38 uMconvert_units("mg/L","uM",chem.cas="80-05-7")# MW Diclofenac is 296.148 g/mol# 1 uM -> 296.148/1000 = 0.296convert_units("uM","mg/L",chem.name="diclofenac")# ppmv only works for gasses:try(convert_units("uM","ppmv",chem.name="styrene"))convert_units("uM","ppmv",chem.name="styrene",state="gas")# Compare with https://www3.epa.gov/ceampubl/learn2model/part-two/onsite/ia_unit_conversion.html# 1 ug/L Toluene -> 0.263 ppmvconvert_units("ug/L","ppmv",chem.name="toluene",state="gas")# 1 pppmv Toluene, 0.0038 mg/Lconvert_units("ppmv","mg/L",chem.name="toluene",state="gas")MW_pyrene <- get_physchem_param(param='MW', chem.name='pyrene')conversion_factor <- convert_units(input.units='mg/L', output.units ='uM', MW=MW_pyrene)calc_mc_oral_equiv(15, parameters=p)Create a table of parameter values for Monte Carlo
Description
This is the HTTK master function for creating a data table foruse with Monte Carlo methods to simulate parameter uncertainty andvariabilit. Each column of the output table corresponds to an HTTK modelparameter and each row corresponds to a different random draw (for example,different individuals when considering biological variability). Thisfunction call three different key functions to simulate parameter parameteruncertainty and/or variability in one of three ways. First parameters canbe varied in an uncorrelated manner using truncated normal distributions bythe functionmonte_carlo. Then, physiological parameters canbe varied in a correlated manner according to theRing et al. (2017)(doi:10.1016/j.envint.2017.06.004)httk-pop approach by thefunctionhttkpop_mc. Next, both uncertainty and variabilityof in vitro HTTK parameters can be simulated by the functioninvitro_mc as described byWambaugh et al. (2019)(doi:10.1093/toxsci/kfz205). Finally, tissue-specific partitioncoefficients are predicted for each draw using theSchmitt (2008)(doi:10.1016/j.tiv.2007.09.010) method as calibrated toin vivodata by Pearce et al. (2017)(doi:10.1007/s10928-017-9548-7) and implemented inpredict_partitioning_schmitt.
Usage
create_mc_samples( chem.cas = NULL, chem.name = NULL, dtxsid = NULL, parameters = NULL, samples = 1000, species = "Human", suppress.messages = FALSE, model = "3compartmentss", httkpop = TRUE, invitrouv = TRUE, calcrb2p = TRUE, censored.params = list(), vary.params = list(), return.samples = FALSE, tissue = NULL, httkpop.dt = NULL, invitro.mc.arg.list = NULL, adjusted.Funbound.plasma = NA, adjusted.Clint = NA, httkpop.generate.arg.list = list(method = "direct resampling"), convert.httkpop.arg.list = NULL, propagate.invitrouv.arg.list = NULL, parameterize.args.list = NULL, Caco2.options = NULL)Arguments
chem.cas | Chemical Abstract Services Registry Number (CAS-RN) – ifparameters is not specified then the chemical must be identified by eitherCAS, name, or DTXISD |
chem.name | Chemical name (spaces and capitalization ignored) – ifparameters is not specified then the chemical must be identified by eitherCAS, name, or DTXISD |
dtxsid | EPA's DSSTox Structure ID(https://comptox.epa.gov/dashboard)– if parameters is not specified then the chemical must be identified byeither CAS, name, or DTXSIDs |
parameters | Parameters from the appropriate parameterization functionfor the model indicated by argument model |
samples | Number of samples generated in calculating quantiles. |
species | Species desired (either "Rat", "Rabbit", "Dog", "Mouse", ordefault "Human"). Species must be set to "Human" to run httkpop model. |
suppress.messages | Whether or not to suppress output message. |
model | Model used in calculation: 'pbtk' for the multiple compartmentmodel,'3compartment' for the three compartment model, '3compartmentss' forthe three compartment steady state model, and '1compartment' for onecompartment model. This only applies when httkpop=TRUE andspecies="Human", otherwise '3compartmentss' is used. |
httkpop | Whether or not to use theRing et al. (2017) "httkpop" populationgenerator. Species must be 'Human'. |
invitrouv | Logical to indicate whether to include in vitro parameterssuch as intrinsic hepatic clearance rate and fraction unbound in plasma inuncertainty and variability analysis |
calcrb2p | Logical determining whether or not to recalculate thechemical ratio of blood to plasma |
censored.params | The parameters listed in censored.params are sampledfrom a normal distribution that is censored for values less than the limitof detection (specified separately for each parameter). This argumentshould be a list of sub-lists. Each sublist is named for a parameter in"parameters" and contains two elements: "CV" (coefficient of variation) and"LOD" (limit of detection, below which parameter values are censored. Newvalues are sampled with mean equal to the value in "parameters" andstandard deviation equal to the mean times the CV. Censored values aresampled on a uniform distribution between 0 and the limit of detection. Notused with httkpop model. |
vary.params | The parameters listed in vary.params are sampled from anormal distribution that is truncated at zero. This argument should be alist of coefficients of variation (CV) for the normal distribution. Eachentry in the list is named for a parameter in "parameters". New values aresampled with mean equal to the value in "parameters" and standard deviationequal to the mean times the CV. Not used with httkpop model. |
return.samples | Whether or not to return the vector containing thesamples from the simulation instead of the selected quantile. |
tissue | Desired steady state tissue conentration. |
httkpop.dt | A data table generated by |
invitro.mc.arg.list | Additional parameters passed to |
adjusted.Funbound.plasma | Deprecated argument – useparameterize.args.list |
adjusted.Clint | Deprecated argument – use parameterize.args.list |
httkpop.generate.arg.list | Additional parameters passed to |
convert.httkpop.arg.list | Additional parameters passed to theconvert_httkpop_* function for the model. |
propagate.invitrouv.arg.list | Additional parameters passed to model'sassociated in vitro uncertainty and variability propagation function |
parameterize.args.list | Additional parameters passed to theparameterize_* function for the model. |
Caco2.options | Arguments describing how to handle Caco2 absorption datathat are passed to |
Details
The Monte Carlo methods used here were recently updated anddescribed by Breen et al. (2022).
We aim to make any function that uses chemical identifiers (name, CAS,DTXSID) also work if passed a complete vector of parameters (that is, a rowfrom the table generated by this function). This allows the use of MonteCarlo to vary the parameters and therefore vary the function output.Depending on the type of parameters (for example, physiological vs. invitro measurements) we vary the parameters in different ways with differentfunctions.
NOTE: This function calculates oral bioavailability parameters based onCaco2 data. If you are comparing the output of this function to the outputof a model-parameterization function 'parameterize_MODEL()', you will needto to ensure that 'parameterize_MODEL()' also uses Caco2 data. The built-inmodel parameterization functions default to using *in vivo* oralbioavailability data when available. To force them to use Caco2 datainstead, please pass the following argument to 'parameterize_MODEL()':'Caco2.options = list(overwrite.invivo = TRUE'.
Value
A data table where each column corresponds to parameters needed forthe specified model and each row represents a different Monte Carlo sampleof parameter values.
Author(s)
Caroline Ring, Robert Pearce, and John Wambaugh
References
Breen M, Wambaugh JF, Bernstein A, Sfeir M, Ring CL (2022).“Simulating toxicokinetic variability to identify susceptible and highly exposed populations.”Journal of Exposure Science & Environmental Epidemiology,32(6), 855–863.doi:10.1038/s41370-022-00491-0.
Pearce RG, Setzer RW, Davis JL, Wambaugh JF (2017).“Evaluation and calibration of high-throughput predictions of chemical distribution to tissues.”Journal of pharmacokinetics and pharmacodynamics,44, 549–565.doi:10.1007/s10928-017-9548-7.
Ring CL, Pearce RG, Setzer RW, Wetmore BA, Wambaugh JF (2017).“Identifying populations sensitive to environmental chemicals by simulating toxicokinetic variability.”Environment International,106, 105–118.doi:10.1016/j.envint.2017.06.004.
Schmitt W (2008).“General approach for the calculation of tissue to plasma partition coefficients.”Toxicology in vitro,22(2), 457–467.doi:10.1016/j.tiv.2007.09.010.
Wambaugh JF, Wetmore BA, Ring CL, Nicolas CI, Pearce RG, Honda GS, Dinallo R, Angus D, Gilbert J, Sierra T, others (2019).“Assessing toxicokinetic uncertainty and variability in risk prioritization.”Toxicological Sciences,172(2), 235–251.doi:10.1093/toxsci/kfz205.
Examples
# We can use the Monte Carlo functions by passing a table# where each row represents a different Monte Carlo draw of parameters:p <- create_mc_samples(chem.cas="80-05-7")# Use data.table for steady-state plasma concentration (Css) Monte Carlo:calc_mc_css(parameters=p)# Using the same table gives the same answer:calc_mc_css(parameters=p)# Use Css for 1 mg/kg/day for simple reverse toxicokinetics# in Vitro-In Vivo Extrapolation to convert 15 uM to mg/kg/day:15/calc_mc_css(parameters=p, output.units="uM")# Can do the same with calc_mc_oral_equiv:calc_mc_oral_equiv(15, parameters=p)#Generate a population using the virtual-individuals method,#including 80 females and 20 males,#including only ages 20-65,#including only Mexican American and#Non-Hispanic Black individuals,#including only non-obese individualsset.seed(42)mypop <- httkpop_generate(method = 'virtual individuals', gendernum=list(Female=80, Male=20), agelim_years=c(20,65), reths=c('Mexican American', 'Non-Hispanic Black'), weight_category=c('Underweight', 'Normal', 'Overweight'))# Including a httkpop.dt argument will overwrite the number of sample and# the httkpop on/off logical switch:samps1 <- create_mc_samples(chem.name="bisphenola", httkpop=FALSE, httkpop.dt=mypop)samps2 <- create_mc_samples(chem.name="bisphenola", httkpop.dt=mypop)# But we can turn httkpop off altogether if desired:samps3 <- create_mc_samples(chem.name="bisphenola", httkpop=FALSE)Dawson et al. 2021 data
Description
This table includes QSAR (Random Forest) model predicted values for unboundfraction plasma protein (fup) and intrinsic hepatic clearance (clint) for asubset of chemicals in the Tox21 library(seehttps://www.epa.gov/chemical-research/toxicology-testing-21st-century-tox21).
Usage
dawson2021Format
data.frame
Details
Predictions were made with a set of Random Forest QSAR models,as reported in Dawson et al. (2021).
Author(s)
Daniel E. Dawson
References
Dawson DE, Ingle BL, Phillips KA, Nichols JW, Wambaugh JF, Tornero-Velez R (2021).“Designing QSARs for Parameters of High-Throughput Toxicokinetic Models Using Open-Source Descriptors.”Environmental Science & Technology,55(9), 6505-6517.doi:10.1021/acs.est.0c06117.PMID: 33856768, https://doi.org/10.1021/acs.est.0c06117.
See Also
Machine Learning PFAS Half-Life Predictions from Dawson et al. 2023
Description
Dawson et al. (2023) Supplemental Information S3 includes half-life predictions for 6603 PFAS, of which 3890 are estimated to be within the applicabilitydomain (AD) for humans. This machine learning (ML) model predicts PFAS half-life as one of four categories. The ML model was trained to a dataset of 91 in vivo measured TK half-lives across 11 PFAS, 4 species, and two sexes. Predictions were a function of compound-specific physico-chemical descriptors, species-specific physiological descriptors, and an indicator variable for sex. The kinetics of PFAS are thought to be complicated by active transport, both through either proximal tubular resorption (into the blood) (Andersen et al. 2006) or secretion (into the urine) (Kudo et al. 2002). The ML model uses several species- and structure-derivedsurrogates for estimating the likelihood of active PFAS transport. Geometryof the proximal tubule was a surrogate for transporter expression: sincesecretion/resorption transporters line the surface of the proximal tubule,the amount of surface area provides an upper limit on the amount oftransporter expression. PFAS similarity to three distinct endogenous ligandswas considered as a surrogate for transporter affinity.
Usage
dawson2023Format
data.frame
Details
The Dawson et al. (2023) half-life categories are:
| Category | Range of Half-Lives |
| 1 | < 12 hours |
| 2 | < 1 week |
| 3 | < 2 months |
| 4 | > 2 months |
The data.frame contains the following columns:
| Column Name | Description |
| DTXSID | CompTox Chemicals Dashboard substance identifier |
| Species | Species for which the prediction was made |
| Sex | Sex for which the prediction was made |
| DosingAdj | Route of dose administration -- intravenous, oral, or other |
| ClassPredFull | The predicted half-life class (category) |
| ClassModDomain | AD estimated from chemical classes of training set |
| AMAD | AD including AD predicted for each model used for descriptors |
References
Dawson DE, Lau C, Pradeep P, Sayre RR, Judson RS, Tornero-Velez R, Wambaugh JF (2023).“A machine learning model to estimate toxicokinetic half-lives of per-and polyfluoro-alkyl substances (PFAS) in multiple species.”Toxics,11(2), 98.
Andersen ME, Clewell III HJ, Tan Y, Butenhoff JL, Olsen GW (2006).“Pharmacokinetic modeling of saturable, renal resorption of perfluoroalkylacids in monkeys?probing the determinants of long plasma half-lives.”Toxicology,227(1-2), 156–164.
Kudo N, Katakura M, Sato Y, Kawashima Y (2002).“Sex hormone-regulated renal transport of perfluorooctanoic acid.”Chemico-biological interactions,139(3), 301–316.
DTXSID number format check function
Description
This function checks whether the DTXSID chemical identifier follows the anticipatedformat of "DTXSID<uniqueID>".
Usage
dtxsid_id_check(dtxsid)Arguments
dtxsid | A character string, or vector of character strings, indicatingDTXSID number. |
Value
Logical output (TRUE or FALSE) indicating whether the character string(s)provided match the anticipated format for a DTXSID chemical identifier.
Predict GFR.
Description
Predict GFR using CKD-EPI equation (for adults) or BSA-based equation (for children).
Usage
estimate_gfr(gfrtmp.dt, gfr_resid_var = TRUE, ckd_epi_race_coeff = FALSE)Arguments
gfrtmp.dt | A data.table with columns |
gfr_resid_var | Logical value indicating whether or not to includeresidual variability when generating GFR values. (Default is TRUE.) |
ckd_epi_race_coeff | Logical value indicating whether or not to use the"race coefficient" from the CKD-EPI equation when estimating GFR values.(Default is FALSE.) |
Details
Add residual variability based on reported residuals for each equation.
Value
The same data.table with agfr_est column added, containing estimated GFR values.
Author(s)
Caroline Ring
References
Ring CL, Pearce RG, Setzer RW, Wetmore BA, Wambaugh JF (2017).“Identifying populations sensitive to environmental chemicals by simulating toxicokinetic variability.”Environment International,106, 105–118.doi:10.1016/j.envint.2017.06.004.
Predict GFR in children.
Description
BSA-based equation from Johnson et al. 2006, Clin Pharmacokinet 45(9) 931-56. Used in Wetmore et al. 2014.
Usage
estimate_gfr_ped(BSA)Arguments
BSA | Vector of body surface areas in m^2. |
Value
Vector of GFRs in mL/min/1.73m^2.
Author(s)
Caroline Ring
References
Ring CL, Pearce RG, Setzer RW, Wetmore BA, Wambaugh JF (2017).“Identifying populations sensitive to environmental chemicals by simulating toxicokinetic variability.”Environment International,106, 105–118.doi:10.1016/j.envint.2017.06.004.
Generate hematocrit values for a virtual population
Description
Predict hematocrit from age using smoothing splines and kernel densityestimates of residual variability fitted to NHANES data, for a givencombination of gender and NHANES race/ethnicity category.
Usage
estimate_hematocrit(gender, reth, age_years, age_months, nhanes_mec_svy)Arguments
gender | Gender for which to generate hematocrit values ("Male" or"Female") |
reth | NHANES race/ethnicity category for which to generate serumcreatinine values ("Mexican American", "Non-Hispanic Black", "Non-HispanicWhite", "Other", or "Other Hispanic") |
age_years | Vector of ages in years for individuals for whom to generatehematocrit values (corresponding to age_months) |
age_months | vector of ages in months for individuals for whom togenerate hematocrit values (between 0-959 months) |
nhanes_mec_svy |
|
Details
This function should usually not be called directly by the user. It is used byhttkpop_generate() in "virtual-individuals" mode, after drawing gender,NHANES race/ethnicity category, and age from their NHANESproportions/distributions.
Value
A vector of numeric generated hematocrit values (blood percentage redblood cells by volume).
Author(s)
Caroline Ring
References
Ring CL, Pearce RG, Setzer RW, Wetmore BA, Wambaugh JF (2017).“Identifying populations sensitive to environmental chemicals by simulating toxicokinetic variability.”Environment International,106, 105–118.doi:10.1016/j.envint.2017.06.004.
SEEM Example DataWe can grab SEEM daily intake rate predictions already in RData format fromhttps://github.com/HumanExposure/SEEM3RPackage/tree/main/SEEM3/dataDownload the file Ring2018Preds.RData
Description
We do not have the space to distribute all the SEEM predictions withinthis R package, but we can give you our "Intro to IVIVE" example chemicals
Usage
example.seemFormat
data.frame
References
Ring CL, Arnot JA, Bennett DH, Egeghy PP, Fantke P, Huang L, Isaacs KK, Jolliet O, Phillips KA, Price PS, others (2018).“Consensus modeling of median chemical intake for the US population based on predictions of exposure pathways.”Environmental science & technology,53(2), 719–732.doi:10.1021/acs.est.8b04056.
ToxCast Example DataThe main page for the ToxCast data is here:https://www.epa.gov/comptox-tools/exploring-toxcast-dataMost useful to us is a single file containing all the hits across all chemcialsand assays:https://clowder.edap-cluster.com/datasets/6364026ee4b04f6bb1409eda?space=62bb560ee4b07abf29f88fef
Description
As of November, 2022 the most recent version was 3.5 and was available as an.Rdata file (invitrodb_3_5_mc5.Rdata)
Usage
example.toxcastFormat
data.frame
Details
Unfortunately for this vignette there are too many ToxCast data to fit into a5mb R package. So we will subset to just the shemicals for the "Intro to IVIVE" vignette and distributeonly those data. In addition, out of 78 columns in the data, we will keep only eight.
Export model to jarnac.
Description
This function exports the multiple compartment PBTK model to a jarnac file.
Usage
export_pbtk_jarnac( initial.amounts = list(Agutlumen = 0), folder = tempdir(), filename = "default.jan", digits = 4, ...)Arguments
initial.amounts | Must specify initial amounts in units of choice. |
folder | The folder on the file system containing the output file. Defaults to |
filename | The name of the jarnac file containing the model. |
digits | Desired number of decimal places to round the parameters. |
... | Arguments to |
Details
Compartments to enter into the initial.amounts list includes Agutlumen,Aart, Aven, Alung, Agut, Aliver, Akidney, and Arest.
Parameters are generated by a call toparameterize_pbtk.When species is specified as rabbit, dog, or mouse, the function uses theappropriate physiological data(volumes and flows) but substitues humanfraction unbound, partition coefficients, and intrinsic hepatic clearance.
Value
Text containing a Jarnac language version of the PBTK model.
Author(s)
Robert Pearce
Examples
export_pbtk_jarnac(chem.name='Nicotine',initial.amounts=list(Agutlumen=1),filename='PBTKmodel.jan')Export model to sbml.
Description
This function exports the multiple compartment PBTK model to an sbml file.
Usage
export_pbtk_sbml( initial.amounts = list(Agutlumen = 0), filename = "default.xml", folder = tempdir(), digits = 4, ...)Arguments
initial.amounts | Must specify initial amounts in units of choice. |
filename | The name of the jarnac file containing the model. |
folder | The folder on the file system containing the output file. Defaults to |
digits | Desired number of decimal places to round the parameters. |
... | Arguments to |
Details
Compartments to enter into the initial.amounts list includes Agutlumen,Aart, Aven, Alung, Agut, Aliver, Akidney, and Arest.
Parameters are generated by a call toparameterize_pbtk.When species is specified as rabbit, dog, or mouse, the function uses theappropriate physiological data(volumes and flows) but substitues humanfraction unbound, partition coefficients, and intrinsic hepatic clearance.
Value
Text describing the PBTK model in SBML.
Author(s)
Robert Pearce
Examples
export_pbtk_sbml(chem.name='Nicotine',initial.amounts=list(Agutlumen=1),filename='PBTKmodel.xml')Generate demographic parameters for a virtual population
Description
Generate gender, NHANES race/ethnicity category, ages, heights, and weightsfor a virtual population, based on NHANES data.
Usage
gen_age_height_weight( nsamp = NULL, gendernum = NULL, reths, weight_category, agelim_years, agelim_months, nhanes_mec_svy)Arguments
nsamp | The desired number of individuals in the virtual population. |
gendernum | Optional: A named list giving the numbers of male and femaleindividuals to include in the population, e.g. |
reths | Optional: a character vector giving the races/ethnicities toinclude in the population. Default is |
weight_category | Optional: The weight categories to include in thepopulation. Default is |
agelim_years | Optional: A two-element numeric vector giving the minimumand maximum ages (in years) to include in the population. Default isc(0,79). If |
agelim_months | Optional: A two-element numeric vector giving the minimumand maximum ages (in months) to include in the population. Default is c(0,959), equivalent to the default |
nhanes_mec_svy |
|
Details
This function should usually not be called directly by the user. It is used byhttkpop_generate() in "virtual-individuals" mode.
Value
A data.table containing variables
genderGender of each virtual individual
rethRace/ethnicity of each virtual individual
age_monthsAge in months of each virtual individual
age_yearsAge in years of each virtual individual
weightBody weight in kg of each virtual individual
heightHeight in cm of each virtual individual
Author(s)
Caroline Ring
References
Ring CL, Pearce RG, Setzer RW, Wetmore BA, Wambaugh JF (2017).“Identifying populations sensitive to environmental chemicals by simulating toxicokinetic variability.”Environment International,106, 105–118.doi:10.1016/j.envint.2017.06.004.
importFrom survey svymean
Generate heights and weights for a virtual population.
Description
Predict height and weight from age using smoothing splines, and then addresidual variability from a 2-D KDE, both fitted to NHANES data, for a givencombination of gender and NHANES race/ethnicity category.
Usage
gen_height_weight(gender, reth, age_months, nhanes_mec_svy)Arguments
gender | Gender for which to calculate height/weight ("Male" or "Female") |
reth | NHANES race/ethnicity category for which to calculateheight/weight ("Mexican American", "Non-Hispanic Black", "Non-HispanicWhite", "Other", or "Other Hispanic") |
age_months | vector of ages in months for individuals for whom tocalculate height/weight (between 0-959 months) |
nhanes_mec_svy |
|
Details
This function should usually not be called directly by the user. It is used byhttkpop_generate() in "virtual-individuals" mode, after drawing gender,NHANES race/ethnicity category, and age from their NHANESproportions/distributions.
Value
A list containing two named elements,weight andheight,each of which is a numeric vector.weight gives individual bodyweights in kg, andheight gives individual heights in cm,corresponding to each item in the inputage_months.
Author(s)
Caroline Ring
References
Ring CL, Pearce RG, Setzer RW, Wetmore BA, Wambaugh JF (2017).“Identifying populations sensitive to environmental chemicals by simulating toxicokinetic variability.”Environment International,106, 105–118.doi:10.1016/j.envint.2017.06.004.
Generate serum creatinine values for a virtual population.
Description
Predict serum creatinine from age using smoothing splines and kernel densityestimates of residual variability fitted to NHANES data,, for a givencombination of gender and NHANES race/ethnicity category.
Usage
gen_serum_creatinine(gender, reth, age_years, age_months, nhanes_mec_svy)Arguments
gender | Gender for which to generate serum creatinine values ("Male" or"Female") |
reth | NHANES race/ethnicity category for which to generate serumcreatinine values ("Mexican American", "Non-Hispanic Black", "Non-HispanicWhite", "Other", or "Other Hispanic") |
age_years | Vector of ages in years for individuals for whom to generateserum creatinine values (corresponding to age_months) |
age_months | vector of ages in months for individuals for whom togenerate serum creatinine values (between 0-959 months) |
nhanes_mec_svy |
|
Details
This function should usually not be called directly by the user. It is usedbyhttkpop_generate() in "virtual-individuals" mode, after drawinggender, NHANES race/ethnicity category, and age from their NHANESproportions/distributions.
Value
A vector of numeric generated serum creatinine values (mg/dL).
Author(s)
Caroline Ring
References
Ring CL, Pearce RG, Setzer RW, Wetmore BA, Wambaugh JF (2017).“Identifying populations sensitive to environmental chemicals by simulating toxicokinetic variability.”Environment International,106, 105–118.doi:10.1016/j.envint.2017.06.004.
Retrieve chemical information on 2023 EPA PFAS Chemicals
Description
This function is a wrapper forget_cheminfo that only listschemicals from the Smeltz, Kreutz, and Crizer data sets collected on PFASbetween 2019 and 2022. Plasma protein binding (fraction unbound) data werecollected using ultracentrifugation (UC) instead of rapid equilibriumdialysis. Intrsinsic hepatic clearance (Clint) data were collected withsubstrate depletion (over time) assays.
Usage
get_2023pfasinfo( info = "CAS", species = "Human", fup.lod.default = 0.005, model = "3compartmentss", default.to.human = FALSE, median.only = FALSE, fup.ci.cutoff = FALSE, clint.pvalue.threshold = 0.05, suppress.messages = FALSE)Arguments
info | A single character vector (or collection of character vectors)from "Compound", "CAS", "DTXSID, "logP", "pKa_Donor"," pKa_Accept", "MW", "Clint","Clint.pValue", "Funbound.plasma","Structure_Formula", or "Substance_Type". info="all"gives all information for the model and species. |
species | Species desired (either "Rat", "Rabbit", "Dog", "Mouse", ordefault "Human"). |
fup.lod.default | Default value used for fraction of unbound plasma forchemicals where measured value was below the limit of detection. Defaultvalue is 0.0005. |
model | Model used in calculation, 'pbtk' for the multiple compartmentmodel, '1compartment' for the one compartment model, '3compartment' forthree compartment model, '3compartmentss' for the three compartment modelwithout partition coefficients, or 'schmitt' for chemicals with logP andfraction unbound (used in predict_partitioning_schmitt). |
default.to.human | Substitutes missing values with human values iftrue. |
median.only | Use median values only for fup and clint. Default is FALSE. |
fup.ci.cutoff | Cutoff for the level of uncertainty in fup estimates.This value should be between (0,1). Default is 'NULL' specifying no filtering. |
clint.pvalue.threshold | Hepatic clearance for chemicals where the invitro clearance assay result has a p-values greater than the threshold areset to zero. |
suppress.messages | Whether or not the output messages are suppressed. |
Details
Note that in some cases theFunbound.plasma and theintrinsic clearance areprovided as a series of numbers separated by commas. These values are the result of Bayesian analysis and characterize a distribution: the first valueis the median of the distribution, while the second and third values are the lower and upper 95th percentile (that is qunatile 2.5 and 97.5) respectively.For intrinsic clearance a fourth value indicating a p-value for a decrease isprovided. Typically 4000 samples were used for the Bayesian analusis, suchthat a p-value of "0" is equivale to "<0.00025". See Wambaugh et al. (2019)for more details. If argument meadian.only == TRUE then only the median isreported for parameters with Bayesian analysis distributions. If the 95credible interval is larger than fup.ci.cutoff (defaultsto NULL) then the Fup is treated as too uncertain and the value NA is given.
Value
vector/data.table | Table (if info has multiple entries) or vector containing a column for each valid entry specified in the argument "info" and a row for each chemical with sufficientdata for the model specified by argument "model":
|
Author(s)
John Wambaugh
Examples
PFASCssTable <- NULLfor (this.id in get_2023pfasinfo(info="dtxsid")){ PFASCssTable <- rbind(PFASCssTable, data.frame( DTXSID = this.id, Css = try(calc_analytic_css(dtxsid=this.id, model="sumclearancespfas", suppress.messages=TRUE ))))}Retrieve in vitro measured Caco-2 membrane permeabilit
Description
This function checks for chemical-specific in vitro measurements of the Caco-2 membrane permeability in thechem.physical_and_invitro.data table. If no value is available argumentCaco2.Pab.default is returned.Anywhere that the values is reported by three numbers separated by a comma (this also happens for plasma protein binding) the three values are: median, lower 95 percent confidence intervals, upper 95 percent confidence interval. Unless you are doing monte carlo work it makes sense to ignore the second and third values.
Usage
get_caco2( chem.cas = NULL, chem.name = NULL, dtxsid = NULL, Caco2.Pab.default = 1.6, suppress.messages = FALSE)Arguments
chem.cas | Chemical Abstract Services Registry Number (CAS-RN) – the chemical must be identified by either CAS, name, or DTXISD |
chem.name | Chemical name (spaces and capitalization ignored) – the chemical must be identified by either CAS, name, or DTXISD |
dtxsid | EPA's DSSTox Structure ID (https://comptox.epa.gov/dashboard)– the chemical must be identified by either CAS, name, or DTXSIDs |
Caco2.Pab.default | sets the default value for Caco2.Pab if Caco2.Pab is unavailable. |
suppress.messages | Whether or not the output message is suppressed. |
Author(s)
John Wambaugh
Retrieve chemical identity from HTTK package
Description
Given one of chem.name, chem.cas (Chemical Abstract Service Registry Number),or DTXSID (DSStox Substance Identifierhttps://comptox.epa.gov/dashboard) thisfunction checks if the chemical is available and, if so, returns all threepieces of information.
Usage
get_chem_id(chem.cas = NULL, chem.name = NULL, dtxsid = NULL)Arguments
chem.cas | CAS regstry number |
chem.name | Chemical name |
dtxsid | DSSTox Substance identifier |
Value
A list containing the following chemical identifiers:
chem.cas | CAS registry number |
chem.name | Name |
dtxsid | DTXSID |
Author(s)
John Wambaugh and Robert Pearce
Retrieve chemical information available from HTTK package
Description
This function lists information on all the chemicals within HTTK for which there are sufficient data for the specified model and species. By default the function returns only CAS (that is, info="CAS"). The type of information available includes chemical identifiers ("Compound", "CAS", "DTXSID"), in vitromeasurements ("Clint", "Clint.pvalue", "Funbound plasma", "Rblood2plasma"), and physico-chemical information ("Formula", "logMA", "logP", "MW","pKa_Accept", "pKa_Donor"). The argument "info" can be a single type of information, "all" information, or a vector of specific types of information.The argument "model" defaults to "3compartmentss" and the argument "species" defaults to "human". Since different models have different requirements and not all chemicals have complete data, this function will return different numbers of chemicals depending on the model specified. Ifa chemical is not listed by get_cheminfo then either the in vitro orphysico-chemical data needed are currently missing (but could potentiallybe added usingadd_chemtable.
Usage
get_cheminfo( info = "CAS", species = "Human", fup.lod.default = 0.005, model = "3compartmentss", default.to.human = FALSE, median.only = FALSE, fup.ci.cutoff = TRUE, clint.pvalue.threshold = 0.05, physchem.exclude = TRUE, class.exclude = TRUE, suppress.messages = FALSE)Arguments
info | A single character vector (or collection of character vectors)from "Compound", "CAS", "DTXSID, "logP", "pKa_Donor"," pKa_Accept", "MW", "Clint","Clint.pValue", "Funbound.plasma","Structure_Formula", or "Substance_Type". info="all"gives all information for the model and species. |
species | Species desired (either "Rat", "Rabbit", "Dog", "Mouse", ordefault "Human"). |
fup.lod.default | Default value used for fraction of unbound plasma forchemicals where measured value was below the limit of detection. Defaultvalue is 0.0005. |
model | Model used in calculation, 'pbtk' for the multiple compartmentmodel, '1compartment' for the one compartment model, '3compartment' forthree compartment model, '3compartmentss' for the three compartment modelwithout partition coefficients, or 'schmitt' for chemicals with logP andfraction unbound (used in predict_partitioning_schmitt). |
default.to.human | Substitutes missing values with human values iftrue. |
median.only | Use median values only for fup and clint. Default is FALSE. |
fup.ci.cutoff | Boolean eliminating uncertain fup estimates.If TRUE, fup values whose 95spans 0.1 to 0.9 (or more) are eliminated. (Default value is TRUE.) |
clint.pvalue.threshold | Hepatic clearance for chemicals where the invitro clearance assay result has a p-values greater than the threshold areset to zero. |
physchem.exclude | Exclude chemicals on the basis of physico-chemicalproperties (currently only Henry's law constant) as specified by the relevant modelinfo_[MODEL] file (default TRUE). |
class.exclude | Exclude chemical classes identified as outside of domain of applicability by the relevant modelinfo_[MODEL] file (default TRUE). |
suppress.messages | Whether or not the output messages are suppressed (default FALSE). |
Details
When default.to.human is set to TRUE, and the species-specific data,Funbound.plasma and Clint, are missing fromchem.physical_and_invitro.data, human values are given instead.
In some cases the rapid equilibrium dialysis method (Waters et al., 2008)fails to yield detectable concentrations for the free fraction of chemical. In those cases we assume the compound is highly bound (that is, Fup approacheszero). For some calculations (for example, steady-state plasma concentration)there is precedent (Rotroff et al., 2010) for using half the average limit of detection, that is, 0.005 (this value is configurable via the argumentfup.lod.default). We do not recommend using other models where quantities like partition coefficients must be predicted using Fup. We alsodo not recommend including the value 0.005 in training sets for Fup predictivemodels.
Note that in some cases theFunbound.plasma (fup) and theintrinsic clearance (clint) areprovided as a series of numbers separated by commas. These values are the result of Bayesian analysis and characterize a distribution: the first valueis the median of the distribution, while the second and third values are the lower and upper 95th percentile (that is quantile 2.5 and 97.5) respectively.For intrinsic clearance a fourth value indicating a p-value for a decrease isprovided. Typically 4000 samples were used for the Bayesian analysis, suchthat a p-value of "0" is equivalent to "<0.00025". See Wambaugh et al. (2019)for more details. If argument median.only == TRUE then only the median isreported for parameters with Bayesian analysis distributions. If the 95credible interval spans the range of 0.1 to 0.9 and fup.ci.cutoff is set to TRUE,i.e., the default setting, then the Fup is treated as too uncertain andthe value NA is given.
Value
vector/data.table | Table (if info has multiple entries) or vector containing a column for each valid entry specified in the argument "info" and a row for each chemical with sufficientdata for the model specified by argument "model":
|
Author(s)
John Wambaugh, Robert Pearce, and Sarah E. Davidson
References
Rotroff DM, Wetmore BA, Dix DJ, Ferguson SS, Clewell HJ, Houck KA, LeCluyse EL, Andersen ME, Judson RS, Smith CM, others (2010).“Incorporating human dosimetry and exposure into high-throughput in vitro toxicity screening.”Toxicological Sciences,117(2), 348–358.doi:10.1093/toxsci/kfq220.
Waters NJ, Jones R, Williams G, Sohal B (2008).“Validation of a rapid equilibrium dialysis approach for the measurement of plasma protein binding.”Journal of pharmaceutical sciences,97(10), 4586–4595.doi:10.1002/jps.21317.
Wambaugh JF, Wetmore BA, Ring CL, Nicolas CI, Pearce RG, Honda GS, Dinallo R, Angus D, Gilbert J, Sierra T, others (2019).“Assessing toxicokinetic uncertainty and variability in risk prioritization.”Toxicological Sciences,172(2), 235–251.doi:10.1093/toxsci/kfz205.
Examples
# List all CAS numbers for which the 3compartmentss model can be run in humans: get_cheminfo()get_cheminfo(info=c('compound','funbound.plasma','logP'),model='pbtk') # See all the data for humans:get_cheminfo(info="all")TPO.cas <- c("741-58-2", "333-41-5", "51707-55-2", "30560-19-1", "5598-13-0", "35575-96-3", "142459-58-3", "1634-78-2", "161326-34-7", "133-07-3", "533-74-4", "101-05-3", "330-54-1", "6153-64-6", "15299-99-7", "87-90-1", "42509-80-8", "10265-92-6", "122-14-5", "12427-38-2", "83-79-4", "55-38-9", "2310-17-0", "5234-68-4", "330-55-2", "3337-71-1", "6923-22-4", "23564-05-8", "101-02-0", "140-56-7", "120-71-8", "120-12-7", "123-31-9", "91-53-2", "131807-57-3", "68157-60-8", "5598-15-2", "115-32-2", "298-00-0", "60-51-5", "23031-36-9", "137-26-8", "96-45-7", "16672-87-0", "709-98-8", "149877-41-8", "145701-21-9", "7786-34-7", "54593-83-8", "23422-53-9", "56-38-2", "41198-08-7", "50-65-7", "28434-00-6", "56-72-4", "62-73-7", "6317-18-6", "96182-53-5", "87-86-5", "101-54-2", "121-69-7", "532-27-4", "91-59-8", "105-67-9", "90-04-0", "134-20-3", "599-64-4", "148-24-3", "2416-94-6", "121-79-9", "527-60-6", "99-97-8", "131-55-5", "105-87-3", "136-77-6", "1401-55-4", "1948-33-0", "121-00-6", "92-84-2", "140-66-9", "99-71-8", "150-13-0", "80-46-6", "120-95-6","128-39-2", "2687-25-4", "732-11-6", "5392-40-5", "80-05-7", "135158-54-2", "29232-93-7", "6734-80-1", "98-54-4", "97-53-0", "96-76-4", "118-71-8", "2451-62-9", "150-68-5", "732-26-3", "99-59-2", "59-30-3", "3811-73-2", "101-61-1", "4180-23-8", "101-80-4", "86-50-0", "2687-96-9", "108-46-3", "95-54-5", "101-77-9", "95-80-7", "420-04-2", "60-54-8", "375-95-1", "120-80-9","149-30-4", "135-19-3", "88-58-4", "84-16-2", "6381-77-7", "1478-61-1", "96-70-8", "128-04-1", "25956-17-6", "92-52-4", "1987-50-4", "563-12-2", "298-02-2", "79902-63-9", "27955-94-8")httk.TPO.rat.table <- subset(get_cheminfo(info="all",species="rat"), CAS %in% TPO.cas) httk.TPO.human.table <- subset(get_cheminfo(info="all",species="human"), CAS %in% TPO.cas) # create a data.frame with all the Fup values, we ask for model="schmitt" since# that model only needs fup, we ask for "median.only" because we don't care# about uncertainty intervals here:fup.tab <- get_cheminfo(info="all",median.only=TRUE,model="schmitt")# calculate the median, making sure to convert to numeric values:median(as.numeric(fup.tab$Human.Funbound.plasma),na.rm=TRUE)# calculate the mean:mean(as.numeric(fup.tab$Human.Funbound.plasma),na.rm=TRUE)# count how many non-NA values we have (should be the same as the number of # rows in the table but just in case we ask for non NA values:sum(!is.na(fup.tab$Human.Funbound.plasma))Retrieve and parse intrinsic hepatic clearance
Description
This function retrieves the chemical- and species-specific intinsichepatic clearance (Clint,inits of uL/min/million hepatocytes) fromchem.physical_and_invitro.data. If that parameter is described by a distribution (that is, a median, lower-, upper-95th percentile and p-value separated by commas) this function splits those quantiles into separate values. Most Clint values have anaccompanying p-value indicating the probability that no decrease was observed. If the p-values exceeds a threhsold (default 0.05) the clearance isset to zero (no clearance). Some values extracted from the literature do nothave a p-value.
Usage
get_clint( chem.cas = NULL, chem.name = NULL, dtxsid = NULL, species = "Human", default.to.human = FALSE, force.human.clint = FALSE, suppress.messages = FALSE, clint.pvalue.threshold = 0.05)Arguments
chem.cas | Chemical Abstract Services Registry Number (CAS-RN) – ifparameters is not specified then the chemical must be identified by eitherCAS, name, or DTXISD |
chem.name | Chemical name (spaces and capitalization ignored) – ifparameters is not specified then the chemical must be identified by eitherCAS, name, or DTXISD |
dtxsid | EPA's DSSTox Structure ID (https://comptox.epa.gov/dashboard)– if parameters is not specified then the chemical must be identified by either CAS, name, or DTXSIDs |
species | Species desired (either "Rat", "Rabbit", "Dog", "Mouse", ordefault "Human"). |
default.to.human | Substitutes missing hepatic clearance withhuman values if true. |
force.human.clint | If a non-human species value (matching argumentspecies) is available, it is ignored and the human intrinsic clearance is used |
suppress.messages | Whether or not the output message is suppressed. |
clint.pvalue.threshold | Hepatic clearance for chemicals where the invitro clearance assay result has a p-values greater than the threshold areset to zero. |
Value
list containing:
CLint.point | Point estimate (central tendency) of the intrinsic hepatic clearance |
Clint.dist | Quantiles of a distribution (median, lower, upper 95th percentiles) and pvalue |
Clint.pvalue | pvalue for whether disapperance of parent compound was observed |
Author(s)
John Wambaugh
See Also
chem.physical_and_invitro.data
Retrieve or calculate fraction of chemical absorbed from the gut
Description
This function checks for chemical-specific in vivo measurements of the fraction absorbed from thegut in thechem.physical_and_invitro.data table. If in vivodata are unavailable (orkeepit100 == TRUE) we attempt to use in vitro Caco-2 membrane permeability to predict the fractions according tocalc_fbio.oral.
Usage
get_fbio( parameters = NULL, chem.cas = NULL, chem.name = NULL, dtxsid = NULL, species = "Human", Caco2.Pab.default = 1.6, Caco2.Fgut = TRUE, Caco2.Fabs = TRUE, overwrite.invivo = FALSE, keepit100 = FALSE, suppress.messages = FALSE, ...)Arguments
parameters | A list of the parameters (Caco2.Pab, Funbound.Plasma, Rblood2plasma,Clint, BW, Qsmallintestine, Fabs, Fgut) used in the calculation, either supplied by useror calculated in parameterize_steady_state. |
chem.cas | Chemical Abstract Services Registry Number (CAS-RN) – the chemical must be identified by either CAS, name, or DTXISD |
chem.name | Chemical name (spaces and capitalization ignored) – the chemical must be identified by either CAS, name, or DTXISD |
dtxsid | EPA's DSSTox Structure ID (https://comptox.epa.gov/dashboard)– the chemical must be identified by either CAS, name, or DTXSIDs |
species | Species desired (either "Rat", "Rabbit", "Dog", "Mouse", ordefault "Human"). |
Caco2.Pab.default | sets the default value for Caco2.Pab if Caco2.Pab is unavailable. |
Caco2.Fgut | = TRUE uses Caco2.Pab to calculate fgut.oral, otherwise fgut.oral = |
Caco2.Fabs | = TRUE uses Caco2.Pab to calculatefabs.oral, otherwise fabs.oral = |
overwrite.invivo | = TRUE overwrites Fabs and Fgut in vivo values from literature with Caco2 derived values if available. |
keepit100 | TRUE overwrites Fabs and Fgut with 1 (i.e. 100 percent) regardless of other settings. |
suppress.messages | Whether or not the output message is suppressed. |
... | Additional parameters passed to parameterize function if parameters is NULL. |
Author(s)
Greg Honda and John Wambaugh
See Also
Retrieve and parse fraction unbound in plasma
Description
This function retrieves the chemical- and species-specific fractionunbound in plasma (fup) fromchem.physical_and_invitro.data. If that parameter is described by a distribution (that is, a median, lower-, and upper-95th percentile separated by commas) this function splits those quantiles into separate values.
Usage
get_fup( chem.cas = NULL, chem.name = NULL, dtxsid = NULL, species = "Human", default.to.human = FALSE, force.human.fup = FALSE, suppress.messages = FALSE, minimum.Funbound.plasma = 1e-04)Arguments
chem.cas | Chemical Abstract Services Registry Number (CAS-RN) – ifparameters is not specified then the chemical must be identified by eitherCAS, name, or DTXISD |
chem.name | Chemical name (spaces and capitalization ignored) – ifparameters is not specified then the chemical must be identified by eitherCAS, name, or DTXISD |
dtxsid | EPA's DSSTox Structure ID (https://comptox.epa.gov/dashboard)– if parameters is not specified then the chemical must be identified by either CAS, name, or DTXSIDs |
species | Species desired (either "Rat", "Rabbit", "Dog", "Mouse", ordefault "Human"). |
default.to.human | Substitutes missing fraction of unbound plasma withhuman values if true. |
force.human.fup | If a non-human species value (matching argumentspecies) is available, it is ignored and the human fraction unbound isreturned |
suppress.messages | Whether or not the output message is suppressed. |
minimum.Funbound.plasma | fup is not allowed to drop below this value (default is 0.0001). |
Value
list containing:
Funbound.plasma.point | Point estimate (central tendency) of the Unbound fraction in plasma |
Funbound.plasma.dist | Quantiles of a distribution (median, lower and upper 95th percentiles) for the unbound fraction |
Author(s)
John Wambaugh
See Also
chem.physical_and_invitro.data
Categorize kidney function by GFR.
Description
For adults: In general GFR > 60 is considered normal 15 < GFR < 60 is considered kidney disease GFR < 15 is considered kidney failure
Usage
get_gfr_category(age_years, age_months, gfr_est)Arguments
age_years | Vector of ages in years. |
age_months | Vector of ages in months. |
gfr_est | Vector of estimated GFR values in mL/min/1.73m^2. |
Details
These values can also be used for children 2 years old and greater (see PEDIATRICS INREVIEW Vol. 29 No. 10 October 1, 2008 pp. 335-341 (doi:10.1542/pir.29-10-335))
Value
Vector of GFR categories: 'Normal', 'Kidney Disease', 'KidneyFailure'.
Author(s)
Caroline Ring
References
Ring CL, Pearce RG, Setzer RW, Wetmore BA, Wambaugh JF (2017).“Identifying populations sensitive to environmental chemicals by simulating toxicokinetic variability.”Environment International,106, 105–118.doi:10.1016/j.envint.2017.06.004.
Get timeseries containing the change of each of the input parameters.
Description
ThedeSolve package uses timeseries as forcing functions. In lieu of hard-coding time evolution of parameters into a model, these timeseries may be usedto change the value of parameters in time. The functionget_input_parm_timeseriesqueries a virutal population and non-parametrically produces timeseries that preserve the percentile score of the given starting values.
Usage
get_input_param_timeseries( model, chem.cas = NULL, chem.name = NULL, dtxsid = NULL, initial.params = NULL, initial.percentiles = NULL, start.age = 360, days = 10, ref.params = NULL, bandwidth = 12, get.median.param.vals = FALSE)Arguments
model | The name of a model which can accept timeseries as forcing functions. |
chem.cas | Chemical Abstract Services Registry Number (CAS-RN) – the chemical must be identified by either CAS, name, or DTXISD |
chem.name | Chemical name (spaces and capitalization ignored) – the chemical must be identified by either CAS, name, or DTXISD |
dtxsid | EPA's 'DSSTox Structure ID (https://comptox.epa.gov/dashboard)– the chemical must be identified by either CAS, name, or DTXSIDs |
initial.params | The values for each parameter at the beginning of the simulation.All compiled parameters should be present. The output of the parameterize_<model>function is appropriate for |
initial.percentiles | If |
start.age | The age in months of the individual at the beginning of the simulation. Used for determining the percentile score of the initial parameter values when producingthe timeseries determining parameter changes. |
days | The length of the simulation in days. Equivalent to the |
ref.params | Model parameters of a reference population used in determiningtimeseries. Recommended column binding ages in months (as |
bandwidth | Dictates the length of time centered around the present to usewhen calculating non-parametric regressions. |
get.median.param.vals | Return, instead of the timeseries, the median valuesfor the dynamic model parameters at the given start age. |
Details
For each time-dependent model, there should be a function that determines the model parameter values for each individual in the NHANES dataset.The resulting value are used to form the non-parametric regression curve.
Value
A list of two-column matrices indexed by names of compiled parameters forthe designated model. The first column contains a list of times (in days) and the second the total change in that parameter from the initial value.
Author(s)
Colin Thomson
See Also
Examples
params <- parameterize_pbtk(chem.name = 'Bisphenol A')pop.phys <- httkpop_generate(method = 'virtual individuals', nsamp = 25000, agelim_years = c(18, 79), weight_category = c("Normal"))pop.params <- create_mc_samples(chem.name = 'Bisphenol A', model = 'pbtk', httkpop.dt = pop.phys)ref.params <- cbind(pop.params, age_months = pop.phys$age_months)ts <- get_input_param_timeseries(model = 'pbtk_lifestage', chem.name = 'Bisphenol A', initial.params = params, start.age = 600, # age fifty days = 365, ref.params = ref.params)Retrieve species-specific in vitro data from chem.physical_and_invitro.data table
Description
This function retrieves in vitro PK data (for example, intrinsic metabolic clearance or fraction unbound in plasma) for the the chemical specified by argument "chem.name", "dtxsid", or chem.cas from the tablechem.physical_and_invitro.data.This function looks for species-specific values based on the argument "species".
Usage
get_invitroPK_param( param, species, chem.name = NULL, chem.cas = NULL, dtxsid = NULL)Arguments
param | The desired parameters, a vector or single value. |
species | Species desired (either "Rat", "Rabbit", "Dog", "Mouse", ordefault "Human"). |
chem.name | The chemical names that you want parameters for, a vector or single value |
chem.cas | The chemical CAS numbers that you want parameters for, a vector or single value |
dtxsid | EPA's 'DSSTox Structure ID (https://comptox.epa.gov/dashboard) |
Details
Note that this function works with a local version of thechem.physical_and_invitro.data table to allow users to add/modify chemicaldata (for example, adding new data viaadd_chemtable or loading in silico predictions distributed with httk viaload_sipes2017,load_pradeep2020,load_dawson2021, orload_honda2023).
User can request via argument param (case-insensitive):
| Parameter | Description | Units |
| [SPECIES].Clint | (Primary hepatocyte suspension) intrinsic hepatic clearance.Entries with comma separated values are Bayesian estimates ofthe Clint distribution - displayed as the median, 95th credible interval(that is quantile 2.5 and 97.5, respectively), and p-value. | uL/min/10^6 hepatocytes |
| [SPECIES].Clint.pValue | Probability that there is no clearance observed. Values close to 1 indicate clearance is not statistically significant. | none |
| [SPECIES].Caco2.Pab | Caco-2 Apical-to-Basal Membrane Permeability | 10^-6 cm/s |
| [SPECIES].Fabs | In vivo measured fraction of an oral dose of chemical absorbed from the gut lumen into the gut | unitless fraction |
| [SPECIES].Fgut | In vivo measured fraction of an oral dose of chemical that passes gut metabolism and clearance | unitless fraction |
| [SPECIES].Foral | In vivo measued fractional systemic bioavailability of an oral dose, modeled as he product of Fabs * Fgut * Fhep (where Fhep is first pass hepatic metabolism). | unitless fraction |
| [SPECIES].Funbound.plasma | Chemical fraction unbound in presence of plasma proteins (fup).Entries with comma separated values are Bayesian estimates ofthe fup distribution - displayed as the median and 95th credible interval(that is quantile 2.5 and 97.5, respectively). | unitless fraction |
| [SPECIES].Rblood2plasma | Chemical concentration blood to plasma ratio | unitless ratio |
Value
The parameters, either a single value, a named list for a single chemical, or a list of lists
Author(s)
John Wambaugh and Robert Pearce
See Also
chem.physical_and_invitro.data
Get literature Chemical Information.
Description
This function provides the information specified in "info=" for allchemicals with data from the Wetmore et al. (2012) and (2013) publicationsand other literature.
Usage
get_lit_cheminfo(info = "CAS", species = "Human")Arguments
info | A single character vector (or collection of character vectors)from"Compound", "CAS", "MW", "Raw.Experimental.Percentage.Unbound","Entered.Experimental.Percentage.Unbound", "Fub", "source_PPB","Renal_Clearance", "Met_Stab", "Met_Stab_entered","r2", "p.val", "Concentration..uM.", "Css_lower_5th_perc.mg.L.", "Css_median_perc.mg.L.", "Css_upper_95th_perc.mg.L.","Css_lower_5th_perc.uM.","Css_median_perc.uM.","Css_upper_95th_perc.uM.",and "Species". |
species | Species desired (either "Rat" or default "Human"). |
Value
info | Table/vector containing values specified in "info" forvalid chemicals. |
Author(s)
John Wambaugh
References
Wetmore BA, Wambaugh JF, Ferguson SS, Sochaski MA, Rotroff DM, Freeman K, Clewell III HJ, Dix DJ, Andersen ME, Houck KA, others (2012).“Integration of dosimetry, exposure, and high-throughput screening data in chemical toxicity assessment.”Toxicological Sciences,125(1), 157–174.doi:10.1093/toxsci/kfr254.
Wetmore BA, Wambaugh JF, Ferguson SS, Li L, Clewell III HJ, Judson RS, Freeman K, Bao W, Sochaski MA, Chu T, others (2013).“Relative impact of incorporating pharmacokinetics on predicting in vivo hazard and mode of action from high-throughput in vitro toxicity assays.”toxicological sciences,132(2), 327–346.doi:10.1093/toxsci/kft012.
Wetmore BA, Wambaugh JF, Allen B, Ferguson SS, Sochaski MA, Setzer RW, Houck KA, Strope CL, Cantwell K, Judson RS, others (2015).“Incorporating high-throughput exposure predictions with dosimetry-adjusted in vitro bioactivity to inform chemical toxicity testing.”Toxicological Sciences,148(1), 121–136.doi:10.1093/toxsci/kfv171.
Examples
get_lit_cheminfo()get_lit_cheminfo(info=c('CAS','MW'))Get literature Css
Description
This function retrieves a steady-state plasma concentration as a result ofinfusion dosing from the Wetmore et al. (2012) and (2013) publications andother literature.
Usage
get_lit_css( chem.cas = NULL, chem.name = NULL, daily.dose = 1, which.quantile = 0.95, species = "Human", clearance.assay.conc = NULL, output.units = "mg/L", suppress.messages = FALSE)Arguments
chem.cas | Either the cas number or the chemical name must bespecified. |
chem.name | Either the chemical name or the CAS number must bespecified. |
daily.dose | Total daily dose infused in units of mg/kg BW/day.Defaults to 1 mg/kg/day. |
which.quantile | Which quantile from the SimCYP Monte Carlo simulationis requested. Can be a vector. |
species | Species desired (either "Rat" or default "Human"). |
clearance.assay.conc | Concentration of chemical used in measureingintrinsic clearance data, 1 or 10 uM. |
output.units | Returned units for function, defaults to mg/L but canalso be uM (specify units = "uM"). |
suppress.messages | Whether or not the output message is suppressed. |
Value
A numeric vector with the literature steady-state plasma concentration (1 mg/kg/day) for the requested quantiles
Author(s)
John Wambaugh
References
Wetmore BA, Wambaugh JF, Ferguson SS, Sochaski MA, Rotroff DM, Freeman K, Clewell III HJ, Dix DJ, Andersen ME, Houck KA, others (2012).“Integration of dosimetry, exposure, and high-throughput screening data in chemical toxicity assessment.”Toxicological Sciences,125(1), 157–174.doi:10.1093/toxsci/kfr254.
Wetmore BA, Wambaugh JF, Ferguson SS, Li L, Clewell III HJ, Judson RS, Freeman K, Bao W, Sochaski MA, Chu T, others (2013).“Relative impact of incorporating pharmacokinetics on predicting in vivo hazard and mode of action from high-throughput in vitro toxicity assays.”toxicological sciences,132(2), 327–346.doi:10.1093/toxsci/kft012.
Wetmore BA, Wambaugh JF, Allen B, Ferguson SS, Sochaski MA, Setzer RW, Houck KA, Strope CL, Cantwell K, Judson RS, others (2015).“Incorporating high-throughput exposure predictions with dosimetry-adjusted in vitro bioactivity to inform chemical toxicity testing.”Toxicological Sciences,148(1), 121–136.doi:10.1093/toxsci/kfv171.
Examples
get_lit_css(chem.cas="34256-82-1")get_lit_css(chem.cas="34256-82-1",species="Rat",which.quantile=0.5)get_lit_css(chem.cas="80-05-7", daily.dose = 1,which.quantile = 0.5, output.units = "uM")Get Literature Oral Equivalent Dose
Description
This function converts a chemical plasma concetration to an oral equivalentdose using the values from the Wetmore et al. (2012) and (2013) publicationsand other literature.
Usage
get_lit_oral_equiv( conc, chem.name = NULL, chem.cas = NULL, dtxsid = NULL, suppress.messages = FALSE, which.quantile = 0.95, species = "Human", input.units = "uM", output.units = "mg", clearance.assay.conc = NULL, ...)Arguments
conc | Bioactive in vitro concentration in units of specifiedinput.units, default of uM. |
chem.name | Either the chemical name or the CAS number must bespecified. |
chem.cas | Either the CAS number or the chemical name must bespecified. |
dtxsid | EPA's 'DSSTox Structure ID (https://comptox.epa.gov/dashboard)the chemical must be identified by either CAS, name, or DTXSIDs |
suppress.messages | Suppress output messages. |
which.quantile | Which quantile from the SimCYP Monte Carlo simulationis requested. Can be a vector. Papers include 0.05, 0.5, and 0.95 forhumans and 0.5 for rats. |
species | Species desired (either "Rat" or default "Human"). |
input.units | Units of given concentration, default of uM but can alsobe mg/L. |
output.units | Units of dose, default of 'mg' for mg/kg BW/ day or'mol' for mol/ kg BW/ day. |
clearance.assay.conc | Concentration of chemical used in measureingintrinsic clearance data, 1 or 10 uM. |
... | Additional parameters passed to get_lit_css. |
Value
Equivalent dose in specified units, default of mg/kg BW/day.
Author(s)
John Wambaugh
References
Wetmore BA, Wambaugh JF, Ferguson SS, Sochaski MA, Rotroff DM, Freeman K, Clewell III HJ, Dix DJ, Andersen ME, Houck KA, others (2012).“Integration of dosimetry, exposure, and high-throughput screening data in chemical toxicity assessment.”Toxicological Sciences,125(1), 157–174.doi:10.1093/toxsci/kfr254.
Wetmore BA, Wambaugh JF, Ferguson SS, Li L, Clewell III HJ, Judson RS, Freeman K, Bao W, Sochaski MA, Chu T, others (2013).“Relative impact of incorporating pharmacokinetics on predicting in vivo hazard and mode of action from high-throughput in vitro toxicity assays.”toxicological sciences,132(2), 327–346.doi:10.1093/toxsci/kft012.
Wetmore BA, Wambaugh JF, Allen B, Ferguson SS, Sochaski MA, Setzer RW, Houck KA, Strope CL, Cantwell K, Judson RS, others (2015).“Incorporating high-throughput exposure predictions with dosimetry-adjusted in vitro bioactivity to inform chemical toxicity testing.”Toxicological Sciences,148(1), 121–136.doi:10.1093/toxsci/kfv171.
Examples
table <- NULLfor(this.cas in sample(get_lit_cheminfo(),50)) table <- rbind(table,cbind(as.data.frame(this.cas),as.data.frame(get_lit_oral_equiv(conc=1,chem.cas=this.cas))))get_lit_oral_equiv(0.1,chem.cas="34256-82-1")get_lit_oral_equiv(0.1,chem.cas="34256-82-1",which.quantile=c(0.05,0.5,0.95))Get physico-chemical parameters from chem.physical_and_invitro.data table
Description
This function retrieves physico-chemical properties ("param") for the chemical specified by chem.name or chem.cas from the tablechem.physical_and_invitro.data. This function is distinguished fromget_invitroPK_param in thatthere are no species-specific values. Physically meaningful values for ionization equilibria are NA/none (that is, no ionization), a single value, or a series of values separated by commas. If logMA (log10 membrane affinity) is NA, we use calc_ma() to predict it later on in the model parameterization functions.
Usage
get_physchem_param(param, chem.name = NULL, chem.cas = NULL, dtxsid = NULL)Arguments
param | The desired parameters, a vector or single value. |
chem.name | The chemical names that you want parameters for, a vector or single value |
chem.cas | The chemical CAS numbers that you want parameters for, a vector or single value |
dtxsid | EPA's 'DSSTox Structure ID (https://comptox.epa.gov/dashboard)the chemical must be identified by either CAS, name, or DTXSIDs |
Details
Note that this function works with a local version of thechem.physical_and_invitro.data table to allow users to add/modify chemicaldata (for example, adding new data viaadd_chemtable or loading in silico predictions distributed with httk viaload_sipes2017,load_pradeep2020,load_dawson2021, orload_honda2023).
User can request the following via argument param (case-insensitive):
| Parameter | Description | Units |
| MW | Molecular weight | g/mole |
| pKa_Donor | Hydrogen donor ionization equilibria (acidic pKa) | pH |
| pKa_Accept | Hyrdogen acceptor ionization equilibria (basic pKa | pH |
| logMA | log10 Membrane Affinity | unitless |
| logP | log10 Octanol:Water Partition Coefficient (hydrophobicity) | unitless |
| logPwa | log10 Water:Air Partition Coefficient | unitless |
| logHenry | log10 Henry's Law Constant | atm-m3/mole |
| logWSol | log10 Water Solubility | moles/L: Water solubility at 25C |
| MP | Melting point | deg C |
Value
The parameters, either a single value, a named list for a single chemical, or a list of lists
Author(s)
John Wambaugh and Robert Pearce
See Also
chem.physical_and_invitro.data
Examples
get_physchem_param(param = 'logP', chem.cas = '80-05-7')get_physchem_param(param = c('logP','MW'), chem.cas = c('80-05-7','81-81-2'))# This function should be case-insensitive:try(get_physchem_param(chem.cas="80-05-7","LogP"))# Asking for a parameter we "don't" have produces an error:try(get_physchem_param(chem.cas="80-05-7","MA"))get_physchem_param(chem.cas="80-05-7","logMA")# Ionization equilibria can be NA/none, a single value, or a series of values# separated by commas:get_physchem_param(chem.cas="80-05-7","pKa_Donor")get_physchem_param(chem.cas="80-05-7","pKa_Accept")get_physchem_param(chem.cas="71751-41-2","pKa_Donor")get_physchem_param(chem.cas="71751-41-2","pKa_Accept")# If logMA (log10 membrane affinity) is NA, we use calc_ma() to predict it# in the parameterization functions:get_physchem_param(chem.cas="71751-41-2","logMA")parameterize_steadystate(chem.cas="71751-41-2")Get ratio of the blood concentration to the plasma concentration.
Description
This function attempts to retrieve a measured species- and chemical-specific blood:plasma concentration ratio.
Usage
get_rblood2plasma( chem.name = NULL, chem.cas = NULL, dtxsid = NULL, species = "Human", default.to.human = FALSE)Arguments
chem.name | Either the chemical name or the CAS number must bespecified. |
chem.cas | Either the CAS number or the chemical name must bespecified. |
dtxsid | EPA's 'DSSTox Structure ID (https://comptox.epa.gov/dashboard)the chemical must be identified by either CAS, name, or DTXSIDs |
species | Species desired (either "Rat", "Rabbit", "Dog", "Mouse", ordefault "Human"). |
default.to.human | Substitutes missing animal values with human valuesif true. |
Details
A value of NA is returned when the requested value is unavailable. Valuesare retrieved from chem.physical_and_invitro.data. details than the description above ~~
Value
A numeric value for the steady-state ratio of chemical concentration in bloodto plasma
Author(s)
Robert Pearce
Examples
get_rblood2plasma(chem.name="Bisphenol A")get_rblood2plasma(chem.name="Bisphenol A",species="Rat")Assign weight class (underweight, normal, overweight, obese)
Description
Given vectors of age, BMI, recumbent length, weight, and gender, categorizesweight classes using CDC and WHO categories.
Usage
get_weight_class(age_years, age_months, bmi, recumlen, weight, gender)Arguments
age_years | A vector of ages in years. |
age_months | A vector of ages in months. |
bmi | A vector of BMIs. |
recumlen | A vector of heights or recumbent lengths in cm. |
weight | A vector of body weights in kg. |
gender | A vector of genders (as 'Male' or 'Female'). |
Details
According to the U.S. Centers for Disease Control and Prevention (CDC)(https://www.cdc.gov/disability-and-health/conditions/obesity.html), adult weightclasses are defined using body mass index (BMI) as follows:
- Underweight
BMIless than 18.5
- Normal
BMI between 18.5 and 25
- Overweight
BMIbetween 25 and 30
- Obese
BMI greater than 30
For children ages 2 years and older, weight classes are defined usingpercentiles of sex-specific BMI for age, as follows (Barlow et al., 2007):
- Underweight
Below 5th percentile BMI for age
- Normal
5th-85th percentile BMI for age
- Overweight
85th-95thpercentile BMI for age
- Obese
Above 95th percentile BMI for age
For children birth to age 2, weight classes are defined using percentiles ofsex-specific weight-for-length (Grummer-Strawn et al., 2009). Weight above the97.7th percentile, or below the 2.3rd percentile, of weight-for-length isconsidered potentially indicative of adverse health conditions. Here, weightbelow the 2.3rd percentile is categorized as "Underweight" and weight abovethe 97.7th percentile is categorized as "Obese."
Value
A character vector of weight classes. Each element will be one of'Underweight', 'Normal', 'Overweight', or 'Obese'.
Author(s)
Caroline Ring
References
Ring CL, Pearce RG, Setzer RW, Wetmore BA, Wambaugh JF (2017).“Identifying populations sensitive to environmental chemicals by simulating toxicokinetic variability.”Environment International,106, 105–118.doi:10.1016/j.envint.2017.06.004.
Barlow SE. Expert committee recommendations regarding the prevention,assessment, and treatment of child and adolescent overweight and obesity:summary report. Pediatrics. 2007;120 Suppl 4. doi:10.1542/peds.2007-2329C
Grummer-Strawn LM, Reinold C, Krebs NF. Use of World Health Organization andCDC growth charts for children Aged 0-59 months in the United States. MorbMortal Wkly Rep. 2009;59(RR-9).https://www.cdc.gov/mmwr/preview/mmwrhtml/rr5909a1.htm
Get literature Chemical Information. (deprecated).
Description
This function is included for backward compatibility. It callsget_lit_cheminfo whichprovides the information specified in "info=" for allchemicals with data from the Wetmore et al. (2012) and (2013) publicationsand other literature.
Usage
get_wetmore_cheminfo( info = "CAS", species = "Human", suppress.messages = FALSE)Arguments
info | A single character vector (or collection of character vectors)from"Compound", "CAS", "MW", "Raw.Experimental.Percentage.Unbound","Entered.Experimental.Percentage.Unbound", "Fub", "source_PPB","Renal_Clearance", "Met_Stab", "Met_Stab_entered","r2", "p.val", "Concentration..uM.", "Css_lower_5th_perc.mg.L.", "Css_median_perc.mg.L.", "Css_upper_95th_perc.mg.L.","Css_lower_5th_perc.uM.","Css_median_perc.uM.","Css_upper_95th_perc.uM.",and "Species". |
species | Species desired (either "Rat" or default "Human"). |
suppress.messages | Whether or not the output message is suppressed. |
Value
info | Table/vector containing values specified in "info" forvalid chemicals. |
Author(s)
John Wambaugh
References
Wetmore BA, Wambaugh JF, Ferguson SS, Sochaski MA, Rotroff DM, Freeman K, Clewell III HJ, Dix DJ, Andersen ME, Houck KA, others (2012).“Integration of dosimetry, exposure, and high-throughput screening data in chemical toxicity assessment.”Toxicological Sciences,125(1), 157–174.doi:10.1093/toxsci/kfr254.
Wetmore BA, Wambaugh JF, Ferguson SS, Li L, Clewell III HJ, Judson RS, Freeman K, Bao W, Sochaski MA, Chu T, others (2013).“Relative impact of incorporating pharmacokinetics on predicting in vivo hazard and mode of action from high-throughput in vitro toxicity assays.”toxicological sciences,132(2), 327–346.doi:10.1093/toxsci/kft012.
Wetmore BA, Wambaugh JF, Allen B, Ferguson SS, Sochaski MA, Setzer RW, Houck KA, Strope CL, Cantwell K, Judson RS, others (2015).“Incorporating high-throughput exposure predictions with dosimetry-adjusted in vitro bioactivity to inform chemical toxicity testing.”Toxicological Sciences,148(1), 121–136.doi:10.1093/toxsci/kfv171.
Examples
get_lit_cheminfo()get_lit_cheminfo(info=c('CAS','MW'))Get literature Css (deprecated).
Description
This function is included for backward compatibility. It callsget_lit_css whichretrieves a steady-state plasma concentration as a result ofinfusion dosing from the Wetmore et al. (2012) and (2013) publications andother literature.
Usage
get_wetmore_css( chem.cas = NULL, chem.name = NULL, daily.dose = 1, which.quantile = 0.95, species = "Human", clearance.assay.conc = NULL, output.units = "mg/L", suppress.messages = FALSE)Arguments
chem.cas | Either the cas number or the chemical name must bespecified. |
chem.name | Either the chemical name or the CAS number must bespecified. |
daily.dose | Total daily dose infused in units of mg/kg BW/day.Defaults to 1 mg/kg/day. |
which.quantile | Which quantile from the SimCYP Monte Carlo simulationis requested. Can be a vector. |
species | Species desired (either "Rat" or default "Human"). |
clearance.assay.conc | Concentration of chemical used in measureingintrinsic clearance data, 1 or 10 uM. |
output.units | Returned units for function, defaults to mg/L but canalso be uM (specify units = "uM"). |
suppress.messages | Whether or not the output message is suppressed. |
Value
A numeric vector with the literature steady-state plasma concentration (1 mg/kg/day) for the requested quantiles
Author(s)
John Wambaugh
References
Wetmore BA, Wambaugh JF, Ferguson SS, Sochaski MA, Rotroff DM, Freeman K, Clewell III HJ, Dix DJ, Andersen ME, Houck KA, others (2012).“Integration of dosimetry, exposure, and high-throughput screening data in chemical toxicity assessment.”Toxicological Sciences,125(1), 157–174.doi:10.1093/toxsci/kfr254.
Wetmore BA, Wambaugh JF, Ferguson SS, Li L, Clewell III HJ, Judson RS, Freeman K, Bao W, Sochaski MA, Chu T, others (2013).“Relative impact of incorporating pharmacokinetics on predicting in vivo hazard and mode of action from high-throughput in vitro toxicity assays.”toxicological sciences,132(2), 327–346.doi:10.1093/toxsci/kft012.
Wetmore BA, Wambaugh JF, Allen B, Ferguson SS, Sochaski MA, Setzer RW, Houck KA, Strope CL, Cantwell K, Judson RS, others (2015).“Incorporating high-throughput exposure predictions with dosimetry-adjusted in vitro bioactivity to inform chemical toxicity testing.”Toxicological Sciences,148(1), 121–136.doi:10.1093/toxsci/kfv171.
Examples
get_lit_css(chem.cas="34256-82-1")get_lit_css(chem.cas="34256-82-1",species="Rat",which.quantile=0.5)get_lit_css(chem.cas="80-05-7", daily.dose = 1,which.quantile = 0.5, output.units = "uM")Get Literature Oral Equivalent Dose (deprecated).
Description
This function is included for backward compatibility. It callsget_lit_oral_equiv whichconverts a chemical plasma concetration to an oral equivalentdose using the values from the Wetmore et al. (2012) and (2013) publicationsand other literature.
Usage
get_wetmore_oral_equiv( conc, chem.name = NULL, chem.cas = NULL, suppress.messages = FALSE, which.quantile = 0.95, species = "Human", input.units = "uM", output.units = "mg", clearance.assay.conc = NULL, ...)Arguments
conc | Bioactive in vitro concentration in units of specifiedinput.units, default of uM. |
chem.name | Either the chemical name or the CAS number must bespecified. |
chem.cas | Either the CAS number or the chemical name must bespecified. |
suppress.messages | Suppress output messages. |
which.quantile | Which quantile from the SimCYP Monte Carlo simulationis requested. Can be a vector. Papers include 0.05, 0.5, and 0.95 forhumans and 0.5 for rats. |
species | Species desired (either "Rat" or default "Human"). |
input.units | Units of given concentration, default of uM but can alsobe mg/L. |
output.units | Units of dose, default of 'mg' for mg/kg BW/ day or'mol' for mol/ kg BW/ day. |
clearance.assay.conc | Concentration of chemical used in measureingintrinsic clearance data, 1 or 10 uM. |
... | Additional parameters passed to get_lit_css. |
Value
Equivalent dose in specified units, default of mg/kg BW/day.
Author(s)
John Wambaugh
References
Wetmore BA, Wambaugh JF, Ferguson SS, Sochaski MA, Rotroff DM, Freeman K, Clewell III HJ, Dix DJ, Andersen ME, Houck KA, others (2012).“Integration of dosimetry, exposure, and high-throughput screening data in chemical toxicity assessment.”Toxicological Sciences,125(1), 157–174.doi:10.1093/toxsci/kfr254.
Wetmore BA, Wambaugh JF, Ferguson SS, Li L, Clewell III HJ, Judson RS, Freeman K, Bao W, Sochaski MA, Chu T, others (2013).“Relative impact of incorporating pharmacokinetics on predicting in vivo hazard and mode of action from high-throughput in vitro toxicity assays.”toxicological sciences,132(2), 327–346.doi:10.1093/toxsci/kft012.
Wetmore BA, Wambaugh JF, Allen B, Ferguson SS, Sochaski MA, Setzer RW, Houck KA, Strope CL, Cantwell K, Judson RS, others (2015).“Incorporating high-throughput exposure predictions with dosimetry-adjusted in vitro bioactivity to inform chemical toxicity testing.”Toxicological Sciences,148(1), 121–136.doi:10.1093/toxsci/kfv171.
Examples
table <- NULLfor(this.cas in sample(get_lit_cheminfo(),50)) table <- rbind(table,cbind(as.data.frame(this.cas),as.data.frame(get_lit_oral_equiv(conc=1,chem.cas=this.cas))))get_lit_oral_equiv(0.1,chem.cas="34256-82-1")get_lit_oral_equiv(0.1,chem.cas="34256-82-1",which.quantile=c(0.05,0.5,0.95))KDE bandwidths for residual variability in hematocrit
Description
Bandwidths used for a one-dimensional kernel density estimation of thedistribution of residual errors around smoothing spline fits of hematocrit vs.age for NHANES respondents in each of ten combinations of sex andrace/ethnicity categories.
Usage
hct_hFormat
A named list with 10 elements, each a numeric value. Each list elementcorresponds to, and is named for, one combination of NHANES sex categories(Male and Female) and NHANES race/ethnicity categories (Mexican American,Other Hispanic, Non-Hispanic White, Non-Hispanic Black, and Other).
Details
Each matrix is the standard deviation for a normal distribution: this is thebandwidth to be used for a kernel density estimation (KDE) (using a normalkernel) of the distribution of residual errors around smoothing spline fits ofhematocrit vs. age for NHANES respondents in the specified sex andrace/ethnicity category. Optimal bandwidths were pre-calculated by doing thesmoothing spline fits, getting the residuals, then callingkde on the residuals (which callshpi tocompute the plug-in bandwidth).
Used by HTTK-Pop only in "virtual individuals" mode (i.e.httkpop_generate withmethod = "v"), inestimate_hematocrit.
Author(s)
Caroline Ring
References
Ring CL, Pearce RG, Setzer RW, Wetmore BA, Wambaugh JF (2017).“Identifying populations sensitive to environmental chemicals by simulating toxicokinetic variability.”Environment International,106, 105–118.doi:10.1016/j.envint.2017.06.004.
Predict hematocrit in infants under 1 year old.
Description
For infants under 1 year, hematocrit was not measured in NHANES. Assume alog-normal distribution where plus/minus 1 standard deviation of theunderlying normal distribution is given by the reference range. Drawhematocrit values from these distributions by age.
Usage
hematocrit_infants(age_months)Arguments
age_months | Vector of ages in months; all must be <= 12. |
Details
| Age | Reference range |
| <1 month | 31-49 |
| 1-6 months | 29-42 |
| 7-12 months | 33-38 |
Value
Vector of hematocrit percentages corresponding to the input vectorof ages.
Author(s)
Caroline Ring
References
Ring CL, Pearce RG, Setzer RW, Wetmore BA, Wambaugh JF (2017).“Identifying populations sensitive to environmental chemicals by simulating toxicokinetic variability.”Environment International,106, 105–118.doi:10.1016/j.envint.2017.06.004.
Return the assumptions used in Honda et al. 2019
Description
This function returns four of the better performing sets of assumptions evaluated in Honda et al. 2019 (https://doi.org/10.1371/journal.pone.0217564).These include four different combinations of hepatic clearance assumption, in vivo bioactivity assumption, and relevant tissue assumption. Generally, this function is not called directly by the user, but insteadcalled by setting the IVIVE option in calc_mc_oral_equiv, calc_mc_css, and calc_analytic functions. Currently, these IVIVE option is not implemented the solve_1comp etc. functions.
Usage
honda.ivive(method = "Honda1", tissue = "liver")Arguments
method | This is set to one of "Honda1", "Honda2", "Honda3", or "Honda4". |
tissue | This is only relevant to "Honda4" and indicates the relevant tissue compartment. |
Details
Only four sets of IVIVE assumptions that performed well in Honda et al. (2019) are currently included:"Honda1" through "Honda4". The use of max (peak) concentration can not be currently be calculated withcalc_analytic_css. The httk default settings correspond to "Honda3":
| In Vivo Conc. | Metabolic Clearance | Bioactive Chemical Conc.In Vivo | TK Statistic Used* | Bioactive Chemical Conc.In Vitro | |
| Honda1 | Veinous (Plasma) | Restrictive | Free | Mean Conc. In Vivo | Free Conc. In Vitro |
| Honda2 | Veinous | Restrictive | Free | Mean Conc. In Vivo | Nominal Conc. In Vitro |
| Honda3 | Veinous | Restrictive | Total | Mean Conc. In Vivo | Nominal Conc. In Vitro |
| Honda4 | Target Tissue | Non-restrictive | Total | Mean Conc. In Vivo | Nominal Conc. In Vitro |
"Honda1" uses plasma concentration, restrictive clearance, and treats the unbound invivo concentration as bioactive. For IVIVE, any input nominal concentration in vitro should be converted to cfree.invitro usingarmitage_eval, otherwise performance will be the same as "Honda2".
Value
A list of tissue, bioactive.free.invivo, and restrictive.clearance assumptions.
Author(s)
Greg Honda and John Wambaugh
References
Honda GS, Pearce RG, Pham LL, Setzer RW, Wetmore BA, Sipes NS, Gilbert J, Franz B, Thomas RS, Wambaugh JF (2019).“Using the concordance of in vitro and in vivo data to evaluate extrapolation assumptions.”PloS one,14(5), e0217564.doi:10.1371/journal.pone.0217564.
Examples
honda.ivive(method = "Honda1", tissue = NULL)Measured Caco-2 Apical-Basal Permeability Data
Description
In vitro Caco-2 membrane permeabilities characterize how readily absobed/transporteda chemical is. These measurements are all for the apical-to-basal Caco-2orientation.These data were either measured by EPA or collected by other others, asindicated by the column 'Data Origin'.Anywhere that the values is reported by three numbers separated by a comma (this also happens for plasma protein binding) the three values are: median, lower 95 percent confidence intervals, upper 95 percent confidence interval. Unless you are doing monte carlo work it makes sense to ignore the second and third values.
Usage
honda2023.dataFormat
An object of classdata.frame with 634 rows and 5 columns.
Details
| Column Name | Description | Units |
| DTXSID | EPA's DSSTox Structure ID (https://comptox.epa.gov/dashboard) | |
| Pab | Apical-to-basal Caco-2 permeability | 10^-6 cm/s |
| Data Origin | The reference which collected/generated the measurement | |
| Test | Whether (1) or not (0) the data was withheld from model building to be used in the QSPR test set | |
| CAS | Chemical Abstracts Service Registry Number |
References
Obringer C, Manwaring J, Goebel C, Hewitt NJ, Rothe H (2016).“Suitability of the in vitro Caco-2 assay to predict the oral absorption of aromatic amine hair dyes.”Toxicology in Vitro,32, 1–7.doi:10.1016/j.tiv.2015.11.007.
Lanevskij K, Didziapetris R (2019).“Physicochemical QSAR analysis of passive permeability across Caco-2 monolayers.”Journal of Pharmaceutical Sciences,108(1), 78–86.doi:10.1016/j.xphs.2018.10.006.
Gaulton A, Bellis LJ, Bento AP, Chambers J, Davies M, Hersey A, Light Y, McGlinchey S, Michalovich D, Al-Lazikani B, others (2012).“ChEMBL: a large-scale bioactivity database for drug discovery.”Nucleic Acids Research,40(D1), D1100–D1107.doi:10.1093/nar/gkr777.
Honda GS, Kenyon EM, Davidson-Fritz S, Dinallo R, El Masri H, Korol-Bexell E, Li L, Angus D, Pearce RG, Sayre RR, others (2025).“Impact of gut permeability on estimation of oral bioavailability for chemicals in commerce and the environment.”ALTEX-Alternatives to animal experimentation,42(1), 56–74.doi:10.14573/altex.2403271.
Predicted Caco-2 Apical-Basal Permeabilities
Description
Honda et al. (2023) describes the construction of a machine-learning quantitative structure-property relationship (QSPR )model for in vitro Caco-2 membrane permeabilites. That model was used to make chemical-specific predictions provided in this table.
Usage
honda2023.qsprFormat
An object of classdata.frame with 14033 rows and 5 columns.
Details
| Column Name | Description | Units |
| DTXSID | EPA's DSSTox Structure ID (https://comptox.epa.gov/dashboard) | |
| Pab.Class.Pred | Predicted Pab rate of slow (1), moderate (2), or fast (3) | |
| Pab.Pred.AD | Whether (1) or not (0) the chemical is anticipated to be withing the QSPR domain of applicability | |
| CAS | Chemical Abstracts Service Registry Number | |
| Pab.Quant.Pred | Median and 95-percent interval for values within the predicted class's training data moderate (2), or fast (3) | 10^-6 cm/s |
References
Honda GS, Kenyon EM, Davidson-Fritz S, Dinallo R, El Masri H, Korol-Bexell E, Li L, Angus D, Pearce RG, Sayre RR, others (2025).“Impact of gut permeability on estimation of oral bioavailability for chemicals in commerce and the environment.”ALTEX-Alternatives to animal experimentation,42(1), 56–74.doi:10.14573/altex.2403271.
See Also
Historical Performance of R Package httk
Description
This table records the historical performance and other metrics of the R package "httk" asprofiled with the functionbenchmark_httk. There is a row foreach version and a column for each benchmark or metric. This table is usedto generate graphs comparing the current version to past performance in orderto help identify unintended degradtion of package capabilities.
Usage
httk.performanceFormat
An object of classdata.frame with 30 rows and 18 columns.
Details
| Column Name | Description |
| Version | The release of httk (major.minor.patch) |
| N.steadystate | The number of chemicals for which Css can be predicted for the steady-state model |
| calc_analytic.units | The ratio of the output ofcalc_analytic_css in mg/L to uM multiplied by 1000/MW (should be 1) |
| calc_mc.units | The ratio of the output ofcalc_mc_css in mg/L to uM multiplied by 1000/MW (should be 1) |
| solve_pbtk.units | The ratio of a Cplasma value fromsolve_pbtk in mg/L to uM multiplied by 1000/MW (should be 1) |
| RMSLE.Wetmore | Root mean squared log10 error between Css predictions from httk and published values from Wetmore papers (both 95th percentile) |
| N.Wetmore | Number of chemicals used in RMSLE evaluation |
| RMSLE.noMC | RMSLE between 95th percentile Css prediction and median prediction |
| N.noMC | Number of chemicals used in RMSLE evaluation |
| RMSLE.InVivoCss | RMSLE for predictions of in vivo measured Css |
| N.InVivoCss | Number of chemicals used in RMSLE evaluation |
| RMSLE.InVivoAUC | RMSLE for predictions of in vivo measured AUCs |
| N.InVivoAUC | Number of chemicals used in RMSLE evaluation |
| RMSLE.InVivoCmax | RMSLE for predictions of in vivo measured Cmax |
| N.InVivoCmax | Number of chemicals used in RMSLE evaluation |
| RMSLE.TissuePC | RMSLE for predicted tissue:plasma partition coefficients |
| N.TissuePC | Number of chemicals used in RMSLE evaluation |
| Notes | Why benchmarks/metrics may have changed |
References
Davidson-Fritz SE, Ring CL, Evans MV, Schacht CM, Chang X, Breen M, Honda GS, Kenyon E, Linakis MW, Meade A, others (2025).“Enabling Transparent Toxicokinetic Modeling for Public Health Risk Assessment.”PLOS ONE,20(4), 1-40.doi:10.1371/journal.pone.0321321.
See Also
HTTK data chemical subsetting function
Description
This function is meant to take any 'httk' data and subset it based on a listof chemicals provided. Main functionality is for speeding up the 'load_sipes2017','load_pradeep2020', 'load_dawson2021', 'load_honda2023', and similar phys-chemdata files. However, it should be generalizable to any dataset with CAS/CASRNor DTXSID chemical identifiers.
Usage
httk_chem_subset(data, chem_include)Arguments
data | Data frame, with chemical data, to be subset. |
chem_include | (character vector) A character vector containingCAS/CASRN or DTXSID chemical identifiers to include in the data subset. |
Value
A subset data set containing only the data rows for chemicals identifiedas those that should be included.
Interact with HTTK vignettes
Description
This function lists the available vignettes, including those from theopetional httkexamples package.
Usage
httk_vignettes(vignette = NULL, ...)Arguments
vignette | The name of a vignette to be displayed. |
... | Additional arguments to function |
Author(s)
John Wambaugh
See Also
Examples
calc_analytic_css(chem.name='Bisphenol-A',output.units='mg/L', model='3compartment',concentration='blood')httkpop: Virtual population generator for HTTK.
Description
The httkpop package generates virtual population physiologies for use in population TK.
Details
To simulate inter-individual variability in the TK model, a MC approachis used: the model parameters are sampled from known or assumeddistributions, and the model is evaluated for each sampled set ofparameters. To simulate variability across subpopulations, the MC approachneeds to capture the parameter correlation structure. For example,kidney function changes with age (Levey et al., 2009), thus thedistribution of GFR is likely different in 6-year-olds than in 65-yearolds.To directly measure the parameter correlation structure, all parametersneed to be measured in each individual in a representativesample population. Such direct measurements are extremely limited.However, the correlation structure of the physiological parameters canbe inferred from their known individual correlations with demographicand anthropometric quantities for which direct population measurementsdo exist. These quantities are sex, race/ethnicity, age, height, andweight (Howgate et al., 2006; Jamei et al., 2009a; Johnson et al., 2006;McNally et al., 2014; Price et al., 2003). Direct measurements of thesequantities in a large, representative sample of the U.S. population arepublicly available from NHANES. NHANES also includes laboratorymeasurements, including both serum creatinine, which can be used toestimate GFR (Levey et al., 2009), and hematocrit. For conciseness, sex,race/ethnicity, age, height, weight, serum creatinine, and hematocritwill be called the NHANES quantities.
HTTK-Pop's correlated MC approach begins by sampling from thejoint distribution of the NHANES quantities to simulate a population.Then, for each individual in the simulated population, HTTKePoppredicts the physiological parameters from the NHANESquantities using regression equations from the literature (Barter et al.,2007; Baxter-Jones et al., 2011; Bosgra et al., 2012; Koo et al., 2000;Levey et al., 2009; Looker et al., 2013; McNally et al., 2014; Ogiu et al.,1997; Price et al., 2003; Schwartz and Work, 2009; Webber and Barr 2012). Correlations among the physiological parameters are induced bytheir mutual dependence on the correlated NHANES quantities. Finally,residual variability is added to the predicted physiological parametersusing estimates of residual marginal variance (i.e., variance not explainedby the regressions on the NHANES quantities) (McNally et al.,2014).
Data were combined from the three most recent publicly-availableNHANES cycles: 2007-2008, 2009-2010, and 2011-2012. For eachcycle, some NHANES quantities - height, weight, serum creatinine,and hematocrit - were measured only in a subset of respondents. Onlythese subsets were included in HTTKePop. The pooled subsets from thethree cycles contained 29,353 unique respondents. Some respondentswere excluded from analysis: those with age recorded as 80 years (becauseall NHANES respondents 80 years and older were marked as"80"); those with missing height, weight or hematocrit data; and thoseaged 12 years or older with missing serum creatinine data. These criteriaexcluded 4807 respondents, leaving 24,546 unique respondents. EachNHANES respondent was assigned a cycle-specific sample weight,which can be interpreted as the number of individuals in the total U.S.population represented by each NHANES respondent in each cycle(Johnson et al., 2013). Because data from three cycles were combined,the sample weights were rescaled (divided by the number of cyclesbeing combined, as recommended in NHANES data analysis documentation)(Johnson et al., 2013). To handle the complex NHANESsampling structure, the R survey package was used to analyze theNHANES data (Lumley, 2004).
To allow generation of virtual populations specified by weight class,we coded a categorical variable for each NHANES respondent. Thecategories Underweight, Normal, Overweight, or Obese were assignedbased on weight, age, and height/length (Grummer-Strawn et al., 2010;Kuczmarski et al., 2002; Ogden et al., 2014; WHO, 2006, 2010). We implemented two population simulation methods within HTTK-Pop:the direct-resampling method and the virtual-individuals method.The direct-resampling method simulated a population by samplingNHANES respondents with replacement, with probabilities proportionalto the sample weights. Each individual in the resulting simulated populationwas an NHANES respondent, identified by a unique NHANESsequence number. By contrast, the second method generates "virtualindividuals" - sets of NHANES quantities that obey the approximatejoint distribution of the NHANES quantities (calculated using weightedsmoothing functions and kernel density estimators), but do not necessarily correspond toany particular NHANES respondent. The direct-resampling method removedthe possibility of generating unrealistic combinations of theNHANES quantities; the virtual-individuals method allowed the use ofinterpolation to simulate subpopulations represented by only a smallnumber of NHANES respondents.
For either method, HTTK-Poptakes optional specifications about the population to be simulatedand then samples from the appropriate conditional jointdistribution of the NHANES quantities.
Once HTTK-Pop has simulated a population characterized by theNHANES quantities, the physiological parameters of the TK modelare predicted from the NHANES quantities using regressionequations from the literature. Liver mass was predicted for individualsover age 18 using allometric scaling with height from Reference Man(Valentin, 2002), and for individuals under 18 using regression relationshipswith height and weight published by Ogiu et al. (1997).Residual marginal variability was added for each individual as inPopGen (McNally et al., 2014). Similarly, hepatic portal vein bloodflows (in L/h) are predicted as fixed fractions of a cardiac output allometricallyscaled with height from Reference Man (Valentin, 2002),and residual marginal variability is added for each individual (McNallyet al., 2014). Glomerular filtration rate (GFR) (in L/h/1.73 m2 bodysurface area) is predicted from age, race, sex, and serum creatinineusing the CKD-EPI equation, for individuals over age 18 (Levey et al.,2009). For individuals under age 18, GFR is estimated from body surfacearea (BSA) (Johnson et al., 2006); BSA is predicted using Mosteller'sformula (Verbraecken et al., 2006) for adults and Haycock'sformula (Haycock et al., 1978) for children. Hepatocellularity (in millionsof cells per gram of liver tissue) is predicted from age using anequation developed by Barter et al. (2007). Hematocrit is estimatedfrom NHANES data for individuals 1 year and older. For individualsyounger than 1 year, for whom NHANES did not measure hematocritdirectly, hematocrit was predicted from age in months, using publishedreference ranges (Lubin, 1987).
In addition to the HTTK physiological parameters, the HTTK modelsinclude chemical-specific parameters representing the fraction of chemicalunbound in plasma (Fup) and intrinsic clearance (CLint). Becausethese parameters represent interactions of the chemical with the body,their values will vary between individuals. To simulate this variability,Fub and CLint were included in MC simulations, by sampling from estimatedor assumed distributions for the parameters defining them.
Variability in hematocrit was simulated either using NHANES data(for individuals ages 1 and older) or using age-based reference ranges(for individuals under age 1). Fup was treated as a random variableobeying a distribution censored below the average limit of quantification(LOQ) of the in vitro assay. Specifically, Fup was assumed to obey anormal distribution truncated below at 0 and above at 1, centered at theFup value measured in vitro, with a 30the average LOQ (0.01), Fup was instead drawn from a uniform distributionbetween 0 and 0.01. Fup was assumed to be independent of allother parameters. This censored normal distribution was chosen tomatch that used in Wambaugh et al. (2015).
Variability in hepatocellularity (106 cells/g liver) and Mliver (kg)were simulated. The remaining source of variability in CLint,h is variabilityin CLint, which was simulated using a Gaussian mixture distributionto represent the population proportions of poor metabolizers(PMs) and non-PMs of each substance. The true prevalence of PMs isisozyme-specific (Ma et al., 2002; Yasuda et al., 2008); however, isozyme-specific metabolism data were not available for the majority ofchemicals considered. We therefore made a simplifying assumption that5slower than average.With 95a normal distribution truncated below at zero, centered at the valuemeasured in vitro, with a 30CLint was drawn from a PM distribution: a truncated normaldistribution centered on one-tenth of the in vitro value with 30Both CLint itself and the probability of being a PM were assumed to beindependent of all other parameters. The truncated normal nonePMdistribution was chosen because it has been used (with 100in previous work (Rotroff et al., 2010; Wambaugh et al., 2015;Wetmore et al., 2014; Wetmore et al., 2015; Wetmore et al., 2012); thePM distribution was chosen to comport with the nonePM distribution.
Main function to generate a population
If you just want to generatea table of (chemical-independent) population physiology parameters, usehttkpop_generate.
Using HTTK-Pop with HTTK
To generate a population and then run an HTTK model for that population, the workflow is as follows:
Generate a population using
httkpop_generate.Fora given HTTK chemical and general model, convert the population data to corresponding sets of HTTK model parameters using
httkpop_mc.
Author(s)
Caroline Ring
References
Ring CL, Pearce RG, Setzer RW, Wetmore BA, Wambaugh JF (2017).“Identifying populations sensitive to environmental chemicals by simulating toxicokinetic variability.”Environment International,106, 105–118.doi:10.1016/j.envint.2017.06.004.
Levey, A.S., Stevens, L.A., Schmid, C.H., Zhang, Y.L., Castro, A.F., Feldman, H.I., et al.,2009. A new equation to estimate glomerular filtration rate. Ann. Intern. Med. 150,604-612.
Howgate, E., Rowland-Yeo, K., Proctor, N., Tucker, G., Rostami-Hodjegan, A., 2006.Prediction of in vivo drug clearance from in vitro data. I: impact of inter-individualvariability. Xenobiotica 36, 473-497.
Jamei, M., Dickinson, G.L., Rostami-Hodjegan, A., 2009a. A framework for assessinginter-individual variability in pharmacokinetics using virtual human populations andintegrating general knowledge of physical chemistry, biology, anatomy, physiologyand genetics: a tale of 'bottom-up' vs 'top-down' recognition of covariates. Drug Metab.Pharmacokinet. 24, 53-75.
Johnson, T.N., Rostami-Hodjegan, A., Tucker, G.T., 2006. Prediction of the clearance ofeleven drugs and associated variability in neonates, infants and children. Clin.Pharmacokinet. 45, 931-956.
McNally, K., Cotton, R., Hogg, A., Loizou, G., 2014. PopGen: a virtual human populationgenerator. Toxicology 315, 70-85.
Price, P.S., Conolly, R.B., Chaisson, C.F., Gross, E.A., Young, J.S., Mathis, E.T., et al.,2003. Modeling interindividual variation in physiological factors used in PBPKmodels of humans. Crit. Rev. Toxicol. 33, 469-503.
Barter, Z.E., Bayliss, M.K., Beaune, P.H., Boobis, A.R., Carlile, D.J., Edwards, R.J., et al.,2007. Scaling factors for the extrapolation of in vivo metabolic drug clearance fromin vitro data: reaching a consensus on values of human micro-somal protein andhepatocellularity per gram of liver. Curr. Drug Metab. 8, 33-45.
Baxter-Jones, A.D., Faulkner, R.A., Forwood, M.R., Mirwald, R.L., Bailey, D.A., 2011.Bone mineral accrual from 8 to 30 years of age: an estimation of peak bone mass. J.Bone Miner. Res. 26, 1729-1739.
Bosgra, S., van Eijkeren, J., Bos, P., Zeilmaker, M., Slob, W., 2012. An improved model topredict physiologically based model parameters and their inter-individual variabilityfrom anthropometry. Crit. Rev. Toxicol. 42, 751-767.
Koo, W.W., Walters, J.C., Hockman, E.M., 2000. Body composition in human infants atbirth and postnatally. J. Nutr. 130, 2188-2194.
Looker, A., Borrud, L., Hughes, J., Fan, B., Shepherd, J., Sherman, M., 2013. Total bodybone area, bone mineral content, and bone mineral density for individuals aged 8years and over: United States, 1999-2006. In: Vital and health statistics Series 11,Data from the National Health Survey, pp. 1-78.
Ogiu, N., Nakamura, Y., Ijiri, I., Hiraiwa, K., Ogiu, T., 1997. A statistical analysis of theinternal organ weights of normal Japanese people. Health Phys. 72, 368-383.
Schwartz, G.J., Work, D.F., 2009. Measurement and estimation of GFR in children andadolescents. Clin. J. Am. Soc. Nephrol. 4, 1832-1843.
Webber, C.E., Barr, R.D., 2012. Age-and gender-dependent values of skeletal muscle massin healthy children and adolescents. J. Cachex. Sarcopenia Muscle 3, 25-29.
Johnson, C.L., Paulose-Ram, R., Ogden, C.L., Carroll, M.D., Kruszon-Moran, D.,Dohrmann, S.M., et al., 2013. National health and nutrition examination survey:analytic guidelines, 1999-2010. Vital and health statistics Series 2. Data Eval.Methods Res. 1-24.
Lumley, T., 2004. Analysis of complex survey samples. J. Stat. Softw. 9, 1-19.
Grummer-Strawn, L.M., Reinold, C.M., Krebs, N.F., Control, C.f.D.; Prevention, 2010. Useof World Health Organization and CDC Growth Charts for Children Aged 0-59Months in the United States. Department of Health and Human Services, Centers forDisease Control and Prevention.
Kuczmarski, R.J., Ogden, C.L., Guo, S.S., Grummer-Strawn, L.M., Flegal, K.M., Mei, Z.,et al., 2002. 2000 CDC growth charts for the United States: methods and development.Vital Health Stat. Series 11, Data from the national health survey 246, 1-190.
Ogden, C.L., Carroll, M.D., Kit, B.K., Flegal, K.M., 2014. Prevalence of childhood andadult obesity in the United States, 2011-2012. JAMA 311, 806-814.
WHO, 2006. In: WHO D.o.N.f.H.a.D. (Ed.), WHO Child Growth Standards: Length/Heightfor-Age, Weight-for-Age, Weight-for-Length, Weight-for-Height and Body Mass Indexfor-Age: Methods and Development.
WHO, 2010. In: (WHO) W.H.O. (Ed.), WHO Anthro for Personal Computers Manual:Software for Assessing Growth and Development of the World's Children, Version3.2.2, 2011. WHO, Geneva.
Valentin, J., 2002. Basic anatomical and physiological data for use in radiological protection:reference values: ICRP publication 89. Ann. ICRP 32, 1-277.
Johnson, T.N., Rostami-Hodjegan, A., Tucker, G.T., 2006. Prediction of the clearance ofeleven drugs and associated variability in neonates, infants and children. Clin.Pharmacokinet. 45, 931-956.
Verbraecken, J., Van de Heyning, P., De Backer, W., Van Gaal, L., 2006. Body surface areain normal-weight, overweight, and obese adults. A comparison study. Metabolism 55,515-524
Haycock, G.B., Schwartz, G.J., Wisotsky, D.H., 1978. Geometric method for measuringbody surface area: a height-weight formula validated in infants, children, and adults.J. Pediatr. 93, 62-66.
Lubin, B., 1987. Reference values in infancy and childhood. In: Nathan, D., Oski, F. (Eds.),Hematology of Infancy and Childhood.
Wambaugh JF, Wetmore BA, Pearce R, Strope C, Goldsmith R, Sluka JP, Sedykh A, Tropsha A, Bosgra S, Shah I, others (2015).“Toxicokinetic triage for environmental chemicals.”Toxicological Sciences,147(1), 55–67.doi:10.1093/toxsci/kfv118.
Ma, M.K., Woo, M.H., Mcleod, H.L., 2002. Genetic basis of drug metabolism. Am. J.Health Syst. Pharm. 59, 2061-2069.
Yasuda, S.U., Zhang, L., Huang, S.M., 2008. The role of ethnicity in variability in responseto drugs: focus on clinical pharmacology studies. Clin. Pharmacol. Ther. 84, 417-423.
Rotroff DM, Wetmore BA, Dix DJ, Ferguson SS, Clewell HJ, Houck KA, LeCluyse EL, Andersen ME, Judson RS, Smith CM, others (2010).“Incorporating human dosimetry and exposure into high-throughput in vitro toxicity screening.”Toxicological Sciences,117(2), 348–358.doi:10.1093/toxsci/kfq220.
Wetmore BA, Wambaugh JF, Ferguson SS, Sochaski MA, Rotroff DM, Freeman K, Clewell III HJ, Dix DJ, Andersen ME, Houck KA, others (2012).“Integration of dosimetry, exposure, and high-throughput screening data in chemical toxicity assessment.”Toxicological Sciences,125(1), 157–174.doi:10.1093/toxsci/kfr254.
Wetmore, B.A., Allen, B., Clewell 3rd, H.J., Parker, T., Wambaugh, J.F., Almond, L.M.,et al., 2014. Incorporating population variability and susceptible subpopulations intodosimetry for high-throughput toxicity testing. Toxicol. Sci. 142, 210-224.
Wetmore BA, Wambaugh JF, Allen B, Ferguson SS, Sochaski MA, Setzer RW, Houck KA, Strope CL, Cantwell K, Judson RS, others (2015).“Incorporating high-throughput exposure predictions with dosimetry-adjusted in vitro bioactivity to inform chemical toxicity testing.”Toxicological Sciences,148(1), 121–136.doi:10.1093/toxsci/kfv171.
Convert HTTK-Pop-generated parameters to HTTK physiological parameters
Description
Convert HTTK-Pop-generated parameters to HTTK physiological parameters
Usage
httkpop_biotophys_default(indiv_dt)Arguments
indiv_dt | The data.table object returned by |
Value
A data.table with the physiological parameters expected by any HTTK model, including body weight (BW), hematocrit, tissue volumes per kg bodyweight, tissue flows as fraction of CO, CO per (kg BW)^3/4, GFR per (kgBW)^3/4, portal vein flow per (kg BW)^3/4, and liver density.
Author(s)
Caroline Ring
References
Ring CL, Pearce RG, Setzer RW, Wetmore BA, Wambaugh JF (2017).“Identifying populations sensitive to environmental chemicals by simulating toxicokinetic variability.”Environment International,106, 105–118.doi:10.1016/j.envint.2017.06.004.
Generate a virtual population by directly resampling the NHANES data.
Description
Generate a virtual population by directly resampling the NHANES data.
Usage
httkpop_direct_resample( nsamp = NULL, gendernum = NULL, agelim_years = NULL, agelim_months = NULL, weight_category = c("Underweight", "Normal", "Overweight", "Obese"), gfr_category = c("Normal", "Kidney Disease", "Kidney Failure"), reths = c("Mexican American", "Other Hispanic", "Non-Hispanic White", "Non-Hispanic Black", "Other"), gfr_resid_var = TRUE, ckd_epi_race_coeff = FALSE, nhanes_mec_svy)Arguments
nsamp | The desired number of individuals in the virtual population. |
gendernum | Optional: A named list giving the numbers of male andfemale individuals to include in the population, e.g. |
agelim_years | Optional: A two-element numeric vector giving theminimum and maximum ages (in years) to include in the population. Default isc(0,79). If |
agelim_months | Optional: A two-element numeric vector giving theminimum and maximum ages (in months) to include in the population. Defaultis c(0, 959), equivalent to the default |
weight_category | Optional: The weight categories to include in thepopulation. Default is |
gfr_category | The kidney function categories to include in thepopulation. Default is |
reths | Optional: a character vector giving the races/ethnicities toinclude in the population. Default is |
gfr_resid_var | Logical value indicating whether or not to includeresidual variability when generating GFR values. (Default is TRUE.) |
ckd_epi_race_coeff | Logical value indicating whether or not to use the"race coefficient" from the CKD-EPI equation when estimating GFR values.(Default is FALSE.) |
nhanes_mec_svy |
|
Value
A data.table where each row represents an individual, and eachcolumn represents a demographic, anthropometric, or physiological parameter.
Author(s)
Caroline Ring
References
Ring CL, Pearce RG, Setzer RW, Wetmore BA, Wambaugh JF (2017).“Identifying populations sensitive to environmental chemicals by simulating toxicokinetic variability.”Environment International,106, 105–118.doi:10.1016/j.envint.2017.06.004.
Inner loop function called byhttkpop_direct_resample.
Description
Inner loop function called byhttkpop_direct_resample.
Usage
httkpop_direct_resample_inner( nsamp, gendernum, agelim_months, agelim_years, reths, weight_category, gfr_resid_var, ckd_epi_race_coeff, nhanes_mec_svy)Arguments
nsamp | The desired number of individuals in the virtual population. |
gendernum | Optional: A named list giving the numbers of male and female individuals to include in the population, e.g. |
agelim_months | Optional: A two-element numeric vector giving the minimumand maximum ages (in months) to include in the population. Default is c(0, 959), equivalent to the default |
agelim_years | Optional: A two-element numeric vector giving the minimum and maximum ages (in years) to include in the population. Default is c(0,79). If |
reths | Optional: a character vector giving the races/ethnicities to include in the population. Default is |
weight_category | Optional: The weight categories to include in the population. Default is |
gfr_resid_var | Logical value indicating whether or not to includeresidual variability when generating GFR values. (Default is TRUE, passed from'httkpop_direct_resample'.) |
ckd_epi_race_coeff | Logical value indicating whether or not to use the"race coefficient" from the CKD-EPI equation when estimating GFR values.(Default is FALSE, passed from 'httkpop_direct_resample'.) |
nhanes_mec_svy |
|
Value
A data.table where each row represents an individual, andeach column represents a demographic, anthropometric, or physiologicalparameter.
Author(s)
Caroline Ring
References
Ring CL, Pearce RG, Setzer RW, Wetmore BA, Wambaugh JF (2017).“Identifying populations sensitive to environmental chemicals by simulating toxicokinetic variability.”Environment International,106, 105–118.doi:10.1016/j.envint.2017.06.004.
Generate a virtual population for PBTK
Description
Generate a virtual population characterized by demographic, anthropometric, and physiological parameters relevant to PBTK.
Usage
httkpop_generate( method, nsamp = NULL, gendernum = NULL, agelim_years = NULL, agelim_months = NULL, weight_category = c("Underweight", "Normal", "Overweight", "Obese"), gfr_category = c("Normal", "Kidney Disease", "Kidney Failure"), reths = c("Mexican American", "Other Hispanic", "Non-Hispanic White", "Non-Hispanic Black", "Other"), gfr_resid_var = TRUE, ckd_epi_race_coeff = FALSE)Arguments
method | The population-generation method to use. Either "virtualindividuals" or "direct resampling." Short names may be used: "d" or "dr"for "direct resampling", and "v" or "vi" for "virtual individuals". |
nsamp | The desired number of individuals in the virtual population. |
gendernum | Optional: A named list giving the numbers of male and femaleindividuals to include in the population, e.g. |
agelim_years | Optional: A two-element numeric vector giving the minimumand maximum ages (in years) to include in the population. Default isc(0,79). If only a single value is provided, both minimum and maximum ageswill be set to that value; e.g. |
agelim_months | Optional: A two-element numeric vector giving theminimum and maximum ages (in months) to include in the population. Defaultis c(0, 959), equivalent to the default |
weight_category | Optional: The weight categories to include in thepopulation. Default is |
gfr_category | The kidney function categories to include in thepopulation. Default is |
reths | Optional: a character vector giving the races/ethnicities toinclude in the population. Default is |
gfr_resid_var | TRUE to add residual variability to GFR predicted fromserum creatinine; FALSE to not add residual variability |
ckd_epi_race_coeff | TRUE to use the CKD-EPI equation as originallypublished (with a coefficient changing predicted GFR for individualsidentified as "Non-Hispanic Black"); FALSE to set this coefficient to 1. |
Details
Demographic and anthropometric (body measures) variables, along with serum creatinine and hematocrit,are generated from survey data from the Centers for Disease Control's National Health and Nutrition Examination Survey (NHANES).Those data are stored in the objectnhanes_mec_svy (asurvey.design object, see packagesurvey).Withmethod = "d", these variables will be sampled with replacement directly from NHANES data. Each NHANES respondent's likelihood of being sampled is given by their sample weight.Withmethod = "v", these variables will be sampled from distributions fitted to NHANES data.Tissue masses and flows are generated based on demographic, body measures, and serum creatinine values, using regression equations from the literature and/or allometric scaling based on height. Extensive details about how each of these parameters are generated are available in the supplemental material of Ring et al. (2017) (see References for full citation).
Value
A data.table where each row represents an individual, and each columnrepresents a demographic, anthropometric, or physiological parameter.Details of the parameters returned and their units are in the following tables.
Demographic variables
| Name | Definition | Units |
seqn | NHANES unique identifier (only included ifmethod = "direct resampling") | NA |
gender | Sex: "Male" or "Female" | NA |
reth | Race/ethnicity: "Non-Hispanic Black", "Non-Hispanic white", "Mexican American", "Other Hispanic", or "Other". | NA |
age_years | Age (0-79 years) | years |
age_months | Age (0-959 months) | months |
Body measures and laboratory measurements
| Name | Definition | Units |
height | Height | cm |
weight | Body weight | kg |
serum_creat | Serum creatinine | mg/dL |
hematocrit | Hematocrit (percentage by volume of red blood cells in blood) | % |
Tissue masses
| Name | Definition | Units |
Blood_mass | Mass of blood | kg |
Brain_mass | Mass of brain | kg |
Gonads_mass | Mass of gonads | kg |
Heart_mass | Mass of heart | kg |
Kidneys_mass | Mass of kidneys | kg |
Large_intestine_mass | Mass of large intestine | kg |
Liver_mass | Mass of liver | kg |
Lung_mass | Mass of lungs | kg |
Muscle_mass | Mass of skeletal muscle | kg |
Pancreas_mass | Mass of pancreas | kg |
Skeleton_mass | Mass of skeleton (including bone, red and yellow marrow, cartilage, periarticular tissue) | kg |
Skin_mass | Mass of skin | kg |
Small_intestine_mass | Mass of small intestine | kg |
Spleen_mass | Mass of spleen | kg |
Stomach_mass | Mass of stomach tissue | kg |
Other_mass | Mass of GI tract contents (1.4% of body weight) and tissues not otherwise enumerated (3.3% of body weight). | kg |
org_mass_sum | Sum of the above tissue masses. A check to ensure this is less than body weight. | kg |
Adipose_mass | Mass of adipose tissue. Assigned asweight - org_mass_sum. | kg |
Tissue flows
| Name | Definition | Units |
Adipose_flow | Blood flow to adipose tissue | L/h |
Brain_flow | Blood flow to brain tissue | L/h |
CO | Cardiac output | L/h |
Gonads_flow | Blood flow to gonads tissue | L/h |
Heart_flow | Blood flow to heart tissue | L/h |
Kidneys_flow | Blood flow to kidneys tissue (not for glomerular filtration!) | L/h |
Large_intestine_flow | Blood flow to large intestine tissue | L/h |
Liver_flow | Blood flow to liver tissue | L/h |
Lung_flow | Blood flow to lung tissue | L/h |
Muscle_flow | Blood flow to skeletal muscle tissue | L/h |
Pancreas_flow | Blood flow to pancreas tissue | L/h |
Skeleton_flow | Blood flow to skeleton | L/h |
Skin_flow | Blood flow to skin | L/h |
Small_intestine_flow | Blood flow to small intestine | L/h |
Spleen_flow | Blood flow to spleen | L/h |
Stomach_flow | Blood flow to stomach | L/h |
org_flow_check | Sum of blood flows as a fraction of cardiac output (CO). A check to make sure this is less than 1. | Unitless fraction |
Adjusted variables
| Name | Definition | Units |
weight_adj | Adjusted body weight: Sum of all tissue masses. | kg |
BSA_adj | Adjusted body surface area, based onheight andweight_adj. | cm^2 |
million.cells.per.gliver | Hepatocellularity | 1e6 cells/g liver |
gfr_est | Glomerular filtration rate (GFR) estimated using either the CKD-EPI equation (for adults) or a body-surface-area-based equation (for children). | mL/min/1.73 m^2 body surface area |
bmi_adj | Body mass index (BMI), adjusted to matchweight_adj andheight. | kg/m^2 |
weight_class | Weight category based onbmi_adj: "Underweight" (BMI < 18.5), "Normal" (18.5 < BMI < 24.9), "Overweight" (25.0 < BMI < 29.9), or "Obese" (BMI >= 30) | Unitless category |
gfr_class | Kidney function category based on GFR: "Normal" (GFR >=60 mL/min/1.73 m^2), "Kidney Disease" (15 <= GFR <= 60), or "Kidney Failure" (GFR < 15). | Unitless category |
Author(s)
Caroline Ring
References
Ring CL, Pearce RG, Setzer RW, Wetmore BA, Wambaugh JF (2017).“Identifying populations sensitive to environmental chemicals by simulating toxicokinetic variability.”Environment International,106, 105–118.doi:10.1016/j.envint.2017.06.004.
Examples
#Simply generate a virtual population of 100 individuals, #using the direct-resampling method set.seed(42)httkpop_generate(method='direct resampling', nsamp=100)#Generate a population using the virtual-individuals method,#including 80 females and 20 males,#including only ages 20-65,#including only Mexican American and#Non-Hispanic Black individuals,#including only non-obese individualsset.seed(42)mypop <- httkpop_generate(method = 'virtual individuals', gendernum=list(Female=80, Male=20), agelim_years=c(20,65), reths=c('Mexican American', 'Non-Hispanic Black'), weight_category=c('Underweight', 'Normal', 'Overweight'))# Including a httkpop.dt argument will overwrite the number of sample and# the httkpop on/off logical switch:samps1 <- create_mc_samples(chem.name="bisphenola", httkpop=FALSE, httkpop.dt=mypop)samps2 <- create_mc_samples(chem.name="bisphenola", httkpop.dt=mypop)samps3 <- create_mc_samples(chem.name="bisphenola", httkpop=FALSE)# Now run calc_mc_oral equiv on the same pop for two different chemcials:calc_mc_oral_equiv(conc=10, chem.name="bisphenola", httkpop.dt=mypop, return.samples=TRUE)calc_mc_oral_equiv(conc=2, chem.name="triclosan", httkpop.dt=mypop, return.samples=TRUE)httk-pop: Correlated human physiological parameter Monte Carlo
Description
This is the core function for httk-pop correlated human physiological variability simulation as described by Ring et al. (2017) (doi:10.1016/j.envint.2017.06.004). This functions takes the data table of population biometrics (one individual per row)generated byhttkpop_generate, and converts itto the corresponding table of HTTK model parameters for a specified HTTK model.
Usage
httkpop_mc(model, samples = 1000, httkpop.dt = NULL, ...)Arguments
model | One of the HTTK models: "1compartment", "3compartmentss","3compartment", or "pbtk". |
samples | The number of Monte Carlo samples to use (can often think of theseas separate individuals) |
httkpop.dt | A data table generated by |
... | Additional arugments passed on to |
Details
The Monte Carlo methods used here were recently updated and described byBreen et al. (submitted).
Value
A data.table with a row for each individual in the sample and a column foreach parater in the model.
Author(s)
Caroline Ring and John Wambaugh
References
Ring CL, Pearce RG, Setzer RW, Wetmore BA, Wambaugh JF (2017).“Identifying populations sensitive to environmental chemicals by simulating toxicokinetic variability.”Environment International,106, 105–118.doi:10.1016/j.envint.2017.06.004.
Breen M, Wambaugh JF, Bernstein A, Sfeir M, Ring CL (2022).“Simulating toxicokinetic variability to identify susceptible and highly exposed populations.”Journal of Exposure Science & Environmental Epidemiology,32(6), 855–863.doi:10.1038/s41370-022-00491-0.
Rowland M, Benet LZ, Graham GG (1973).“Clearance concepts in pharmacokinetics.”Journal of pharmacokinetics and biopharmaceutics,1(2), 123–136.doi:10.1007/BF01059626.
Examples
set.seed(42)indiv_examp <- httkpop_generate(method="d", nsamp=10)httk_param <- httkpop_mc(httkpop.dt=indiv_examp, samples=10, model="1compartment")Generate a virtual population by the virtual individuals method.
Description
Generate a virtual population by the virtual individuals method.
Usage
httkpop_virtual_indiv( nsamp = NULL, gendernum = NULL, agelim_years = NULL, agelim_months = NULL, weight_category = c("Underweight", "Normal", "Overweight", "Obese"), gfr_category = c("Normal", "Kidney Disease", "Kidney Failure"), reths = c("Mexican American", "Other Hispanic", "Non-Hispanic White", "Non-Hispanic Black", "Other"), gfr_resid_var = TRUE, ckd_epi_race_coeff = FALSE, nhanes_mec_svy)Arguments
nsamp | The desired number of individuals in the virtual population. |
gendernum | Optional: A named list giving the numbers of male and femaleindividuals to include in the population, e.g. |
agelim_years | Optional: A two-element numeric vector giving the minimumand maximum ages (in years) to include in the population. Default isc(0,79). If |
agelim_months | Optional: A two-element numeric vector giving the minimumand maximum ages (in months) to include in the population. Default is c(0,959), equivalent to the default |
weight_category | Optional: The weight categories to include in thepopulation. Default is |
gfr_category | The kidney function categories to include in thepopulation. Default is |
reths | Optional: a character vector giving the races/ethnicities toinclude in the population. Default is |
gfr_resid_var | Logical value indicating whether or not to includeresidual variability when generating GFR values. (Default is TRUE.) |
ckd_epi_race_coeff | Logical value indicating whether or not to use the"race coefficient" from the CKD-EPI equation when estimating GFR values.(Default is FALSE.) |
nhanes_mec_svy |
|
Value
A data.table where each row represents an individual, and each columnrepresents a demographic, anthropometric, or physiological parameter.
Author(s)
Caroline Ring
References
Ring CL, Pearce RG, Setzer RW, Wetmore BA, Wambaugh JF (2017).“Identifying populations sensitive to environmental chemicals by simulating toxicokinetic variability.”Environment International,106, 105–118.doi:10.1016/j.envint.2017.06.004.
KDE bandwidth for residual variability in height/weight
Description
Bandwidths used for a two-dimensional kernel density estimation of the jointdistribution of residual errors around smoothing spline fits of height vs. ageand weight vs. age for NHANES respondents in each of ten combinations of sexand race/ethnicity categories.
Usage
hw_HFormat
A named list with 10 elements, each a matrix with 2 rows and 2columns. Each list element corresponds to, and is named for, one combinationof NHANES sex categories (Male and Female) and NHANES race/ethnicitycategories (Mexican American, Other Hispanic, Non-Hispanic White,Non-Hispanic Black, and Other).
Details
Each matrix is a variance-covariance matrix for a two-dimensional normaldistribution: this is the bandwidth to be used for a two-dimensional kerneldensity estimation (KDE) (using a two-dimensional normal kernel) of the jointdistribution of residual errors around smoothing spline fits of height vs. ageand weight vs. age for NHANES respondents in the specified sex andrace/ethnicity category. Optimal bandwidths were pre-calculated by doing thesmoothing spline fits, getting the residuals, then callingkde on the residuals (which callsHpi tocompute the plug-in bandwidth).
Used by HTTK-Pop only in "virtual individuals" mode (i.e.httkpop_generate withmethod = "v"), ingen_height_weight.
Author(s)
Caroline Ring
References
Ring CL, Pearce RG, Setzer RW, Wetmore BA, Wambaugh JF (2017).“Identifying populations sensitive to environmental chemicals by simulating toxicokinetic variability.”Environment International,106, 105–118.doi:10.1016/j.envint.2017.06.004.
Convenience Boolean (yes/no) functions to identify chemical membership inseveral key lists.
Description
These functions allow easy identification of whether or not a chemical CASis included in various research projects. While it is our intent to keepthese lists up-to-date, the information here is only for convenience andshould not be considered to be definitive.
Usage
in.list( chem.name = NULL, chem.cas = NULL, dtxsid = NULL, which.list = "ToxCast")is.tox21(chem.cas)is.toxcast(chem.cas)is.seem(chem.cas)is.nhanes(chem.cas)is.pharma(chem.cas)is.pfas(chem.cas)Arguments
chem.name | One or more Chemical names (spaces and capitalization ignored) – the chemical must be identified by either CAS, name, or DTXISD |
chem.cas | One or more Chemical Abstract Services Registry Numbers (CAS-RN) – the chemical must be identified by either CAS, name, or DTXISD |
dtxsid | One or more of EPA's DSSTox Structure IDs (https://comptox.epa.gov/dashboard)– the chemical must be identified by either CAS, name, or DTXSIDs |
which.list | A character string that can take the following values:"ToxCast", "Tox21", "SEEM", "NHANES", "PFAS", "Pharma"#' |
Details
Tox21: Toxicology in the 21st Century (Tox21) is a U.S. federal HighThroughput Screening (HTS) collaboration among EPA, NIH, including NationalCenter for Advancing Translational Sciences and the National ToxicologyProgram at the National Institute of Environmental Health Sciences, and theFood and Drug Administration. (Bucher et al., 2008)
ToxCast: The Toxicity Forecaster (ToxCast) is a HTS screening project led bythe U.S. EPA to perform additional testing of a subset of Tox21 chemicals.(Judson et al. 2010)
SEEM: Systematic Empirical Evaluation of Models is a consensus exposuremodeling prediction providing a tentative estimate of daily intake ratein units of mg/kg BW/day for chemicals that may have little information on exposure (Ring et al. 2018)
NHANES: The U.S. Centers for Disease Control (CDC) National Health andNutrition Examination Survery (NHANES) is an on-going survey to characterizethe health and biometrics (e.g., weight, height) of the U.S. population. Oneset of measurments includes the quantification of xenobiotic chemicals invarious samples (blood, serum, urine) of the thousands of surveyedindividuals. (CDC, 2014)
Value
logical | A Boolean (1/0) value that is TRUE if the chemical isin the list. |
Functions
is.tox21(): Boolean (yes/no) chemical identity functionsis.toxcast(): Boolean (yes/no) chemical identity functionsis.seem(): Boolean (yes/no) chemical identity functionsis.nhanes(): Boolean (yes/no) chemical identity functionsis.pharma(): Boolean (yes/no) chemical identity functionsis.pfas(): Boolean (yes/no) chemical identity functions
Author(s)
John Wambaugh
References
Bucher, J. R. (2008). Guest Editorial: NTP: New Initiatives, NewAlignment. Environ Health Perspect 116(1).
Judson, R. S., Houck, K. A., Kavlock, R. J., Knudsen, T. B., Martin, M. T.,Mortensen, H. M., Reif, D. M., Rotroff, D. M., Shah, I., Richard, A. M. andDix, D. J. (2010). In Vitro Screening of Environmental Chemicals forTargeted Testing Prioritization: The ToxCast Project. Environmental HealthPerspectives 118(4), 485-492.
Wambaugh, J. F., Wang, A., Dionisio, K. L., Frame, A., Egeghy, P., Judson,R. and Setzer, R. W. (2014). High Throughput Heuristics for PrioritizingHuman Exposure to Environmental Chemicals. Environmental Science &Technology, 10.1021/es503583j.
CDC (2014). National Health and Nutrition Examination Survey. Available at:https://www.cdc.gov/nchs/nhanes.htm.
See Also
is.httk for determining inclusion in httk project
Examples
httk.table <- get_cheminfo(info=c("CAS","Compound"))httk.table[,"Rat"] <- ""httk.table[,"NHANES"] <- ""httk.table[,"Tox21"] <- ""httk.table[,"ToxCast"] <- ""httk.table[,"ExpoCast"] <- ""httk.table[,"PBTK"] <- ""# To make this example run quickly, this loop is only over the first five # chemicals. To build a table with all available chemicals use:# for (this.cas in httk.table$CAS)for (this.cas in httk.table$CAS[1:5]){ this.index <- httk.table$CAS==this.cas if (is.nhanes(chem.cas=this.cas)) httk.table[this.index,"NHANES"] <- "Y" if (is.tox21(chem.cas=this.cas)) httk.table[this.index,"Tox21"] <- "Y" if (is.toxcast(chem.cas=this.cas)) httk.table[this.index,"ToxCast"] <- "Y" if (is.seem(chem.cas=this.cas)) httk.table[this.index,"ExpoCast"] <- "Y" if (is.httk(chem.cas=this.cas,model="PBTK")) httk.table[this.index,"PBTK"] <- "Y" if (is.httk(chem.cas=this.cas,species="rat")) httk.table[this.index,"Rat"] <- "Y"}ToxCast In Vitro Assay Descriptors
Description
ToxCast In Vitro Assay Descriptors
Usage
invitro.assay.paramsFormat
data.table and data.frame
Author(s)
Madison Feshuk
Monte Carlo for in vitro toxicokinetic parameters including uncertainty and variability.
Description
Given a CAS in the HTTK data set, a virtual population from HTTK-Pop, someuser specifications on the assumed distributions of Funbound.plasma andClint, draw "individual" values of Funbound.plasma and Clint from thosedistributions. The methodology for this function was developed and describedby Wambaugh et al. (2019)(doi:10.1093/toxsci/kfz205).
Usage
invitro_mc( parameters.dt = NULL, samples, fup.meas.mc = TRUE, fup.pop.mc = TRUE, clint.meas.mc = TRUE, clint.pop.mc = TRUE, fup.meas.cv = 0.4, clint.meas.cv = 0.3, fup.pop.cv = 0.3, clint.pop.cv = 0.3, caco2.meas.sd = 0.3, caco2.pop.sd = 0.3, Caco2.Fgut = TRUE, Caco2.Fabs = TRUE, keepit100 = FALSE, poormetab = TRUE, fup.lod = 0.01, fup.censored.dist = FALSE, adjusted.Funbound.plasma = TRUE, adjusted.Clint = TRUE, clint.pvalue.threshold = 0.05, minimum.Funbound.plasma = 1e-04)Arguments
parameters.dt | A data table of physiological and chemical-specific parameters |
samples | The number of samples to draw. |
fup.meas.mc | Logical – should we perform measurment (uncertainty)Monte Carlo for |
fup.pop.mc | Logical – should we perform population (variability)Monte Carlo for |
clint.meas.mc | Logical – should we perform measurment (uncertainty)Monte Carlo for |
clint.pop.mc | Logical – should we perform population (variability)Monte Carlo for |
fup.meas.cv | Coefficient of variation of distribution of measured |
clint.meas.cv | Coefficient of variation of distribution of measured |
fup.pop.cv | Coefficient of variation of distribution of population |
clint.pop.cv | Coefficient of variation of distribution of population |
caco2.meas.sd | Standard deviation of the measured oral absorption - numeric value (Default 0.3). |
caco2.pop.sd | Standard deviation of the population level oral absorption - numeric value (Default 0.3). |
Caco2.Fgut | = TRUE uses Caco2.Pab to calculate fgut.oral, otherwise fgut.oral = |
Caco2.Fabs | = TRUE uses Caco2.Pab to calculatefabs.oral, otherwise fabs.oral = |
keepit100 | = TRUE overwrites Fabs and Fgut with 1 (i.e. 100 percent) regardless of other settings. |
poormetab | Logical. Whether to include poor metabolizers in the Clintdistribution or not. |
fup.lod | The average limit of detection for |
fup.censored.dist | Logical. Whether to draw |
adjusted.Funbound.plasma | Uses thePearce et al. (2017) lipid binding adjustmentfor Funbound.plasma when set to TRUE (Default). |
adjusted.Clint | Uses Kilford et al. (2008)hepatocyte incubationbinding adjustment for Clint when set to TRUE (Default). |
clint.pvalue.threshold | Hepatic clearance for chemicals where the invitro clearance assay result has a p-values greater than the threshold areset to zero. |
minimum.Funbound.plasma | Monte Carlo draws less than this value are set equal to this value (default is 0.0001 – half the lowest measured Fup in ourdataset). |
parameters | A list of chemical-specific model parameters containing atleast Funbound.plasma, Clint, and Fhep.assay.correction. |
Details
The Monte Carlo methods used here were recently updated and described byBreen et al. (2022).
Value
A data.table with three columns:Funbound.plasma andClint, containing the sampled values, andFhep.assay.correction, containing the value for fraction unbound inhepatocyte assay.
Author(s)
Caroline Ring and John Wambaugh
References
Breen M, Wambaugh JF, Bernstein A, Sfeir M, Ring CL (2022).“Simulating toxicokinetic variability to identify susceptible and highly exposed populations.”Journal of Exposure Science & Environmental Epidemiology,32(6), 855–863.doi:10.1038/s41370-022-00491-0.
Kilford PJ, Gertz M, Houston JB, Galetin A (2008).“Hepatocellular binding of drugs: correction for unbound fraction in hepatocyte incubations using microsomal binding or drug lipophilicity data.”Drug Metabolism and Disposition,36(7), 1194–1197.doi:10.1124/dmd.108.020834.
Pearce RG, Setzer RW, Davis JL, Wambaugh JF (2017).“Evaluation and calibration of high-throughput predictions of chemical distribution to tissues.”Journal of pharmacokinetics and pharmacodynamics,44, 549–565.doi:10.1007/s10928-017-9548-7.
Wambaugh JF, Wetmore BA, Ring CL, Nicolas CI, Pearce RG, Honda GS, Dinallo R, Angus D, Gilbert J, Sierra T, others (2019).“Assessing toxicokinetic uncertainty and variability in risk prioritization.”Toxicological Sciences,172(2), 235–251.doi:10.1093/toxsci/kfz205.
Examples
#Simply generate a virtual population of 100 individuals,#using the direct-resampling methodset.seed(42)# Pull mean chemical=specific values:chem.props <- parameterize_pbtk(chem.name="bisphenolb")# Convert to data.table with one row per sample:parameters.dt <- monte_carlo(chem.props,samples=100)# Use httk-pop to generate a population:pop <- httkpop_generate(method='direct resampling', nsamp=100)# Overwrite parameters specified by httk-pop:parameters.dt[,names(pop):=pop]# Vary in vitro parameters:parameters.dt <- invitro_mc(parameters.dt,samples=100)Convenience Boolean (yes/no) function to identify chemical membership andtreatment within the httk project.
Description
Allows easy identification of whether or not a chemical CAS is included invarious aspects of the httk research project (by model type and species ofinterest). While it is our intent to keep these lists up-to-date, the information here is only for convenience and should not be considereddefinitive.
Usage
is.httk(chem.cas, species = "Human", model = "3compartmentss")Arguments
chem.cas | The Chemical Abstracts Service Resgistry Number (CAS-RN)corresponding to the chemical of interest. |
species | Species desired (either "Rat", "Rabbit", "Dog", "Mouse", ordefault "Human"). |
model | Model used in calculation, 'pbtk' for the multiple compartmentmodel, '1compartment' for the one compartment model, '3compartment' forthree compartment model, '3compartmentss' for the three compartment modelwithout partition coefficients, or 'schmitt' for chemicals with logP andfraction unbound (used in predict_partitioning_schmitt). |
Details
Tox21: Toxicology in the 21st Century (Tox21) is a U.S. federal HighThroughput Screening (HTS) collaboration among EPA, NIH, including NationalCenter for Advancing Translational Sciences and the National ToxicologyProgram at the National Institute of Environmental Health Sciences, and theFood and Drug Administration. (Bucher et al., 2008)
ToxCast: The Toxicity Forecaster (ToxCast) is a HTS screening project led bythe U.S. EPA to perform additional testing of a subset of Tox21 chemicals.(Judson et al. 2010)
ExpoCast: ExpoCast (Exposure Forecaster) is an U.S. EPA research project togenerate tenetative exposure estimates (e.g., mg/kg BW/day) for thousands ofchemicals that have little other information using models and informatics.(Wambaugh et al. 2014)
NHANES: The U.S. Centers for Disease Control (CDC) National Health andNutrition Examination Survery (NHANES) is an on-going survey to characterizethe health and biometrics (e.g., weight, height) of the U.S. population. Oneset of measurments includes the quantification of xenobiotic chemicals invarious samples (blood, serum, urine) of the thousands of surveyedindividuals. (CDC, 2014)
Value
logical | A Boolean (1/0) value that is TRUE if the chemicalis included in the httk project with a given modeling scheme (PBTK) and a given species |
Author(s)
John Wambaugh
References
Bucher, J. R. (2008). Guest Editorial: NTP: New Initiatives, NewAlignment. Environ Health Perspect 116(1).
Judson, R. S., Houck, K. A., Kavlock, R. J., Knudsen, T. B., Martin, M. T.,Mortensen, H. M., Reif, D. M., Rotroff, D. M., Shah, I., Richard, A. M. andDix, D. J. (2010). In Vitro Screening of Environmental Chemicals forTargeted Testing Prioritization: The ToxCast Project. Environmental HealthPerspectives 118(4), 485-492.
Wambaugh, J. F., Wang, A., Dionisio, K. L., Frame, A., Egeghy, P., Judson,R. and Setzer, R. W. (2014). High Throughput Heuristics for PrioritizingHuman Exposure to Environmental Chemicals. Environmental Science &Technology, 10.1021/es503583j.
CDC (2014). National Health and Nutrition Examination Survey. Available at:https://www.cdc.gov/nchs/nhanes.htm.
See Also
in.list for determining chemical membership in several other key lists
Examples
httk.table <- get_cheminfo(info=c("CAS","Compound"))httk.table[,"Rat"] <- ""httk.table[,"NHANES"] <- ""httk.table[,"Tox21"] <- ""httk.table[,"ToxCast"] <- ""httk.table[,"ExpoCast"] <- ""httk.table[,"PBTK"] <- ""# To make this example run quickly, this loop is only over the first five # chemicals. To build a table with all available chemicals use:# for (this.cas in httk.table$CAS)for (this.cas in httk.table$CAS[1:5]){ this.index <- httk.table$CAS==this.cas if (is.nhanes(chem.cas=this.cas)) httk.table[this.index,"NHANES"] <- "Y" if (is.tox21(chem.cas=this.cas)) httk.table[this.index,"Tox21"] <- "Y" if (is.toxcast(chem.cas=this.cas)) httk.table[this.index,"ToxCast"] <- "Y" if (is.seem(chem.cas=this.cas)) httk.table[this.index,"ExpoCast"] <- "Y" if (is.httk(chem.cas=this.cas,model="PBTK")) httk.table[this.index,"PBTK"] <- "Y" if (is.httk(chem.cas=this.cas,species="rat")) httk.table[this.index,"Rat"] <- "Y"}Checks whether a value, or all values in a vector, is within inclusivelimits
Description
Checks whether a value, or all values in a vector, is within inclusivelimits
Usage
is_in_inclusive(x, lims)Arguments
x | A numeric value, or vector of values. |
lims | A two-element vector of (min, max) values for the inclusivelimits. If |
Value
A logical vector the same length asx, indicating whethereach element ofx is within the inclusive limits given bylims.
Author(s)
Caroline Ring
References
Ring CL, Pearce RG, Setzer RW, Wetmore BA, Wambaugh JF (2017).“Identifying populations sensitive to environmental chemicals by simulating toxicokinetic variability.”Environment International,106, 105–118.doi:10.1016/j.envint.2017.06.004.
Kapraun et al. 2019 data
Description
A list object containing time-varying parameters for the human maternal-fetalHTTK model. List elements contain scalar coefficients for the polynomial,logistic, Gompertz, and other functions of time describing blood flow rates,tissue volumes, hematocrits, and other anatomical/physiological quantitiesthat change in the human mother and her fetus during pregnancy and gestation.
Usage
kapraun2019Format
list
Author(s)
Dustin F. Kapraun
Source
Kapraun DF, Sfeir M, Pearce RG, Davidson-Fritz SE, Lumen A, Dallmann A, Judson RS, Wambaugh JF (2022).“Evaluation of a rapid, generic human gestational dose model.”Reproductive Toxicology,113, 172–188.doi:10.1016/j.reprotox.2022.09.004.
References
Kapraun DF, Wambaugh JF, Setzer RW, Judson RS (2019).“Empirical models for anatomical and physiological changes in a human mother and fetus during pregnancy and gestation.”PLOS ONE,14(5), 1-56.doi:10.1371/journal.pone.0215906.
Predict kidney mass for children
Description
For individuals under age 18, predict kidney mass from weight, height, andgender. using equations from Ogiu et al. 1997
Usage
kidney_mass_children(weight, height, gender)Arguments
weight | Vector of weights in kg. |
height | Vector of heights in cm. |
gender | Vector of genders (either 'Male' or 'Female'). |
Value
A vector of kidney masses in kg.
Author(s)
Caroline Ring
References
Ogiu, Nobuko, et al. "A statistical analysis of the internal organ weights of normal Japanese people." Health physics 72.3 (1997): 368-383.
Ring CL, Pearce RG, Setzer RW, Wetmore BA, Wambaugh JF (2017).“Identifying populations sensitive to environmental chemicals by simulating toxicokinetic variability.”Environment International,106, 105–118.doi:10.1016/j.envint.2017.06.004.
Evaluate the Kramer In Vitro Distribution model
Description
Evaluate the Kramer model for chemical distributionin vitro. Takes inputas data table or vectors of values. Outputs a data table.
Usage
kramer_eval( chem.cas = NULL, chem.name = NULL, dtxsid = NULL, casrn.vector = NA_character_, nomconc.vector = 1, this.well_number = 384, tcdata = NA, user_assay_parameters = NA, this.serum = NA_real_, this.csalt = 0.15, this.BSA = 44, this.v_total = NA_real_, this.v_working = NA_real_, this.cell_yield = NA_real_, this.L_per_mil_cells = 2.772e-06, this.sarea = NA_real_, this.Tsys = 37, this.Tref = 298.15, this.temp_k = 298.15, this.prot_conc = 0.21, this.option.bottom = TRUE, restrict.ion.partitioning = FALSE, surface.area.switch = TRUE)Arguments
chem.cas | A single or vector of Chemical Abstracts Service Registry Number(s) (CAS-RN) of desired chemical(s). |
chem.name | A single or vector of name(s)) of desired chemical(s). |
dtxsid | A single or vector ofEPA's DSSTox Structure ID(s) (https://comptox.epa.gov/dashboard) |
casrn.vector | A deprecated argument specifying a single or vector of Chemical Abstracts Service Registry Number(s) (CAS-RN) of desired chemical(s). |
nomconc.vector | For vector or single value, micromolar (uM = mol/L) nominal concentration (e.g. AC50 value) |
this.well_number | For single value, plate format default is 384, usedif is.na(tcdata)==TRUE. This value chooses default surface area settings for |
tcdata | A data.table with casrn, nomconc,v_total, v_working. Otherwise supply single values to this.params (e.g., this.sarea,this.v_total, etc.). Chemical parameters are taken from |
user_assay_parameters | option to fill in your own assay parameters (data table) |
this.serum | Concentration of serum in media (percent volume/volume) |
this.csalt | Ionic strength of buffer, mol/L |
this.BSA | Bovine serum albumin concentration in serum (g/L) |
this.v_total | Total volume of well (uL) |
this.v_working | Volume of medium per well (uL) |
this.cell_yield | Number of cells/well seeded (unitless) |
this.L_per_mil_cells | Liters per 1 million cells |
this.sarea | Surface area of plastic exposed to medium (m^2) |
this.Tsys | System temperature (Celcius) |
this.Tref | Reference temperature (Kelvin) |
this.temp_k | Temperature (Kelvin) |
this.prot_conc | Cell protein concentration (mg protein/million cells) |
this.option.bottom | Include the bottom of the well in surface area calculation |
restrict.ion.partitioning | only allow neutral fraction to partition |
surface.area.switch | TRUE, automatically calculates surface area, switch to FALSE if user provided |
casrn | description |
well_number | description |
nomconc | Nominal test concentration (uM) |
Value
| Input Parameter | Description | Units |
| concentration_cells | Concentration in cells | uM |
| concentration_medium | Concentration in medium | uM |
| concentration_plastic | Concentration in plastic | umol/m^2 |
| concentration_air | Concentration in headspace | uM |
Author(s)
Meredith Scherer, adapted from code written by L.S Lautz for A. Punt, N. Kramer
References
Kramer NI, others (2010).Measuring, modeling, and increasing the free concentration of test chemicals in cell assays.Utrecht University.
List all available HTTK models
Description
List all available HTTK models
Usage
list_models(names.only = FALSE)Arguments
names.only | If true, only return the model names |
Value
Describes (or lists) available HTTK models
Author(s)
John Wambaugh
Predict liver mass for children
Description
For individuals under 18, predict the liver mass from height, weight, andgender, using equations from Ogiu et al. 1997
Usage
liver_mass_children(height, weight, gender)Arguments
height | Vector of heights in cm. |
weight | Vector of weights in kg. |
gender | Vector of genders (either 'Male' or 'Female'). |
Value
A vector of liver masses in kg.
Author(s)
Caroline Ring
References
Ogiu, Nobuko, et al. "A statistical analysis of the internal organ weights of normal Japanese people." Health physics 72.3 (1997): 368-383.
Ring CL, Pearce RG, Setzer RW, Wetmore BA, Wambaugh JF (2017).“Identifying populations sensitive to environmental chemicals by simulating toxicokinetic variability.”Environment International,106, 105–118.doi:10.1016/j.envint.2017.06.004.
Load CLint and Fup QSPR predictions from Dawson et al. 2021.
Description
This function returns an updated version ofchem.physical_and_invitro.datathat includes Clint and Fup predictions from the Random Forest quantitative structure-property relationship (QSPR) models developed andpresented in Dawson et al. 2021, included in tabledawson2021.
Usage
load_dawson2021( overwrite = FALSE, exclude_oad = TRUE, chem_include = NULL, target.env = .GlobalEnv)Arguments
overwrite | Only matters if load.image=FALSE. If overwrite=TRUE thenexisting data in chem.physical_and_invitro.data will be replaced by anypredictions in Dawson et al. (2021) that is for the same chemical andproperty. If overwrite=FALSE (DEFAULT) then new data for the same chemicaland property are ignored. Funbound.plasma values of 0 (below limit ofdetection) are overwritten either way. |
exclude_oad | Include the chemicals only within the applicability domain.If exclude_oad=TRUE (DEFAULT) chemicals outside the applicability domain do nothave their predicted values loaded. |
chem_include | A vector of CAS numbers indicating only the chemicals tobe included in the loading process. If set to 'NULL' all applicable chemicals areloaded. (Default is 'NULL'.) |
target.env | The environment where the new |
Details
Because Clint and Fup are the only measurements required for many HTTK models,changing the number of chemicals for which a value is available will change the number of chemicals which are listed with theget_cheminfocommand. Use the commandreset_httk to return to the initial (measured only)chem.physical_and_invitro.data (for allparameters).
Value
data.frame | An updated version of |
Author(s)
Sarah E. Davidson
References
Dawson DE, Ingle BL, Phillips KA, Nichols JW, Wambaugh JF, Tornero-Velez R (2021).“Designing QSARs for Parameters of High-Throughput Toxicokinetic Models Using Open-Source Descriptors.”Environmental Science & Technology,55(9), 6505-6517.doi:10.1021/acs.est.0c06117.PMID: 33856768, https://doi.org/10.1021/acs.est.0c06117.
See Also
Examples
# Count how many chemicals for which HTTK is available without the QSPR:num.chems <- length(get_cheminfo())print(num.chems)# For chemicals with Dawson et al. (2021) Clint and Fup QSPR predictions, # add them to our chemical information wherever measured values are # unavailable:load_dawson2021()# For chemicals with Dawson et al. (2021) QSPR predictions, add them to# our chemical information -- overwriting measured values where we had them:load_dawson2021(overwrite=TRUE)# Let's see how many chemicals we have now with the Dawson et al. (2021) # predictions loaded:length(get_cheminfo()) # Now let us reset the chemical data to the initial version:reset_httk()# We should be back to our original number:num.chems == length(get_cheminfo())# Demonstrate loading data for specific chemicals:## Find chemicals with a clint and no fup:subset(chem.physical_and_invitro.data,!is.na(Human.Clint) & Human.Funbound.plasma==0)$CASchem1 <- "32598-13-3"chem2 <- "2971-36-0"# Take a look at what parameterize_steadystate gives (working from a default fup of 0.005):a1 <- parameterize_steadystate(chem.cas=chem1)a2 <- parameterize_steadystate(chem.cas=chem2)# load Dawson for this chemical:load_dawson2021(chem_include=chem1)# Check values, only fup for the first chemical should change:a3 <- parameterize_steadystate(chem.cas=chem1)a4 <- parameterize_steadystate(chem.cas=chem2)# All tests should be true:a1[["Clint"]] == a3[["Clint"]]a1[["Funbound.plasma"]] != a3[["Funbound.plasma"]]a2[["Clint"]] == a4[["Clint"]]a2[["Funbound.plasma"]] == a4[["Funbound.plasma"]]# load Dawson for this chemical, but allow it to overwrite the clint:load_dawson2021(chem_include=chem1, overwrite=TRUE)# Check values, both clint and fup for the first chemical should change:a5 <- parameterize_steadystate(chem.cas=chem1)a6 <- parameterize_steadystate(chem.cas=chem2)# All tests should be true:a1[["Clint"]] != a5[["Clint"]]a1[["Funbound.plasma"]] != a5[["Funbound.plasma"]]a2[["Clint"]] == a6[["Clint"]]a2[["Funbound.plasma"]] == a6[["Funbound.plasma"]]# Load Dawson for all chemicals, fup should change for second chemical:load_dawson2021()a7 <- parameterize_steadystate(chem.cas=chem1)a8 <- parameterize_steadystate(chem.cas=chem2)# All tests should be true:a1[["Clint"]] != a7[["Clint"]]a1[["Funbound.plasma"]] != a7[["Funbound.plasma"]]a2[["Clint"]] == a8[["Clint"]]a2[["Funbound.plasma"]] != a8[["Funbound.plasma"]]# load Dawson for this chemical, but allow it to overwrite all clints:load_dawson2021(overwrite=TRUE)# Both clint and fup should now be changed for second chemical:a9 <- parameterize_steadystate(chem.cas=chem1)a10 <- parameterize_steadystate(chem.cas=chem2)# All tests should be true:a1[["Clint"]] != a9[["Clint"]]a1[["Funbound.plasma"]] != a9[["Funbound.plasma"]]a2[["Clint"]] != a10[["Clint"]]a2[["Funbound.plasma"]] != a10[["Funbound.plasma"]]Load Caco2 pereneability QSPR predictions from Honda et al. 2025
Description
This function returns an updated version ofchem.physical_and_invitro.datathat includes Caco2 Pab predictions from the Random Forest quantitative structure-property relationship (QSPR) models developed andpresented in Honda et al. 2025, included in tablehonda2023.qspr.
Usage
load_honda2025( overwrite = FALSE, exclude_oad = TRUE, chem_include = NULL, target.env = .GlobalEnv)load_honda2023( overwrite = FALSE, exclude_oad = TRUE, chem_include = NULL, target.env = .GlobalEnv)Arguments
overwrite | Only matters if load.image=FALSE. If overwrite=TRUE thenexisting data in chem.physical_and_invitro.data will be replaced by anyprediction in Honda et al. (2025) that is for the same chemical andproperty. If overwrite=FALSE (DEFAULT) then new data for the same chemicaland property are ignored. |
exclude_oad | Include the chemicals only within the applicability domain.If exclude_oad=TRUE (DEFAULT) chemicals outside the applicability domain do nothave their predicted values loaded. |
chem_include | A vector of CAS numbers indicating only the chemicals tobe included in the loading process. If set to 'NULL' all applicable chemicals areloaded. (Default is 'NULL'.) |
target.env | The environment where the new |
Details
Note that because Pab is not required for most HTTK models, changingthe number of chemicals for which a value is available will not change thenumber of chemicals which are listed with theget_cheminfocommand. Use the commandreset_httk to return to the initial (measured only)chem.physical_and_invitro.data (for allparameters).
Value
data.frame | An updated version of |
Functions
load_honda2023(): Load Caco2 pereneability QSPR predictions from Honda et al. 2025
Author(s)
John Wambaugh
References
Honda GS, Kenyon EM, Davidson-Fritz S, Dinallo R, El Masri H, Korol-Bexell E, Li L, Angus D, Pearce RG, Sayre RR, others (2025).“Impact of gut permeability on estimation of oral bioavailability for chemicals in commerce and the environment.”ALTEX-Alternatives to animal experimentation,42(1), 56–74.doi:10.14573/altex.2403271.
See Also
Examples
# For chemicals with Honda et al. (2025) Caco2 Pab QSPR predictions, # add them to our chemical information wherever measured values are # unavailable:load_honda2025()# Or, for chemicals with Honda et al. (2025) QSPR predictions, add them to# our chemical information but overwrite measured values where we had them:load_honda2025(overwrite=TRUE) # Now let us reset the chemical data to the initial version:reset_httk()Load CLint and Fup QSPR predictions predictions from Pradeep et al. 2020.
Description
This function returns an updated version ofchem.physical_and_invitro.datathat includes quantitative structure-property relationship (QSPR) predictions fromSupport Vector Machine and Random Forest models developed and presented in Pradeep et al. 2020, included inpradeep2020.
Usage
load_pradeep2020( overwrite = FALSE, chem_include = NULL, target.env = .GlobalEnv)Arguments
overwrite | Only matters if load.image=FALSE. If overwrite=TRUE thenexisting data in chem.physical_and_invitro.data will be replaced by anypredictions in Pradeep et al. (2020) that is for the same chemical andproperty. If overwrite=FALSE (DEFAULT) then new data for the same chemicaland property are ignored. Funbound.plasma values of 0 (below limit ofdetection) are overwritten either way. |
chem_include | A vector of CAS numbers indicating only the chemicals tobe included in the loading process. If set to 'NULL' all applicable chemicals areloaded. (Default is 'NULL'.) |
target.env | The environment where the new |
Details
Because Clint and Fup are the only measurements required for many HTTK models,changing the number of chemicals for which a value is available will change the number of chemicals which are listed with theget_cheminfocommand. Use the commandreset_httk to return to the initial (measured only)chem.physical_and_invitro.data (for allparameters).
Value
data.frame | An updated version of |
Author(s)
Sarah E. Davidson
References
Pradeep P, Patlewicz G, Pearce R, Wambaugh J, Wetmore B, Judson R (2020).“Using chemical structure information to develop predictive models for in vitro toxicokinetic parameters to inform high-throughput risk-assessment.”Computational Toxicology,16, 100136.ISSN 2468-1113.doi:10.1016/j.comtox.2020.100136.
See Also
Examples
# Count how many chemicals for which HTTK is available without the QSPR:num.chems <- length(get_cheminfo())print(num.chems)# For chemicals with Pradeep et al. (2020) Clint and Fup QSPR predictions, # add them to our chemical information wherever measured values are # unavailable:load_pradeep2020()# Or, for chemicals with Pradeep et al. (2020) QSPR predictions, add them to# our chemical information but overwrite measured values where we had them:load_pradeep2020(overwrite=TRUE) # Let's see how many chemicals we have now with the Pradeep et al. (2020)# predictions data loaded:length(get_cheminfo())# Now let us reset the chemical data to the initial version:reset_httk()# We should be back to our original number:num.chems == length(get_cheminfo())# Demonstrate loading data for specific chemicals:## Find chemicals with a clint and no fup:subset(chem.physical_and_invitro.data,!is.na(Human.Clint) & Human.Funbound.plasma==0)$CASchem1 <- "101-05-3"chem2 <- "2971-36-0"# Take a look at what parameterize_steadystate gives (working from a default fup of 0.005):a1 <- parameterize_steadystate(chem.cas=chem1)a2 <- parameterize_steadystate(chem.cas=chem2)# load Pradeep for this chemical:load_pradeep2020(chem_include=chem1)# Check values, only fup for the first chemical should change:a3 <- parameterize_steadystate(chem.cas=chem1)a4 <- parameterize_steadystate(chem.cas=chem2)# All tests should be true:a1[["Clint"]] == a3[["Clint"]]a1[["Funbound.plasma"]] != a3[["Funbound.plasma"]]a2[["Clint"]] == a4[["Clint"]]a2[["Funbound.plasma"]] == a4[["Funbound.plasma"]]# load Pradeep for this chemical, but allow it to overwrite the clint:load_pradeep2020(chem_include=chem1, overwrite=TRUE)# Check values, both clint and fup for the first chemical should change:a5 <- parameterize_steadystate(chem.cas=chem1)a6 <- parameterize_steadystate(chem.cas=chem2)# All tests should be true:a1[["Clint"]] != a5[["Clint"]]a1[["Funbound.plasma"]] != a5[["Funbound.plasma"]]a2[["Clint"]] == a6[["Clint"]]a2[["Funbound.plasma"]] == a6[["Funbound.plasma"]]# Load Pradeep for all chemicals, fup should change for second chemical:load_pradeep2020()a7 <- parameterize_steadystate(chem.cas=chem1)a8 <- parameterize_steadystate(chem.cas=chem2)# All tests should be true:a1[["Clint"]] != a7[["Clint"]]a1[["Funbound.plasma"]] != a7[["Funbound.plasma"]]a2[["Clint"]] == a8[["Clint"]]a2[["Funbound.plasma"]] != a8[["Funbound.plasma"]]# load Pradeep for this chemical, but allow it to overwrite all clints:load_pradeep2020(overwrite=TRUE)# Both clint and fup should now be changed for second chemical:a9 <- parameterize_steadystate(chem.cas=chem1)a10 <- parameterize_steadystate(chem.cas=chem2)# All tests should be true:a1[["Clint"]] != a9[["Clint"]]a1[["Funbound.plasma"]] != a9[["Funbound.plasma"]]a2[["Clint"]] != a10[["Clint"]]a2[["Funbound.plasma"]] != a10[["Funbound.plasma"]]Load CLint and Fup QSPR predictions from Sipes et al 2017.
Description
This function returns an updated version ofchem.physical_and_invitro.datathat includes quantitative structure-property relationship (QSPR) predictions from Simulations Plus' ADMET predictor as used in Sipes et al. 2017, included insipes2017.
Usage
load_sipes2017(overwrite = FALSE, chem_include = NULL, target.env = .GlobalEnv)Arguments
overwrite | Only matters if load.image=FALSE. If overwrite=TRUE thenexisting data in chem.physical_and_invitro.data will be replaced by anypredictions in Sipes et al. (2017) that is for the same chemical andproperty. If overwrite=FALSE (DEFAULT) then new data for the same chemicaland property are ignored. Funbound.plasma values of 0 (below limit ofdetection) are overwritten either way. |
chem_include | A vector of CAS numbers indicating only the chemicals tobe included in the loading process. If set to 'NULL' all applicable chemicals areloaded. (Default is 'NULL'.) |
target.env | The environment where the new |
Details
Because Clint and Fup are the only measurements required for many HTTK models,changing the number of chemicals for which a value is available will change the number of chemicals which are listed with theget_cheminfocommand. Use the commandreset_httk to return to the initial (measured only)chem.physical_and_invitro.data (for allparameters).
Value
data.frame | An updated version of |
Author(s)
Robert Pearce and John Wambaugh
References
Sipes, Nisha S., et al. "An intuitive approach for predictingpotential human health risk with the Tox21 10k library." EnvironmentalScience & Technology 51.18 (2017): 10786-10796.
See Also
Examples
# Count how many chemicals for which HTTK is available without the QSPR:num.chems <- length(get_cheminfo())print(num.chems)# For chemicals with Sipes et al. (2017) Clint and Fup QSPR predictions, # add them to our chemical information wherever measured values are # unavailable:load_sipes2017()# Here's a chemical we didn't have before (this one is a good test since the # logP is nearly 10 and it probably wouldn't work in vitro):calc_css(chem.cas="26040-51-7")# Let's see how many chemicals we have now with the Sipes et al. (2017) # predictions data loaded:length(get_cheminfo())# Now let us reset the chemical data to the initial version:reset_httk()# We should be back to our original number:num.chems == length(get_cheminfo())# Demonstrate loading data for specific chemicals:## Find chemicals with a clint and no fup:subset(chem.physical_and_invitro.data,!is.na(Human.Clint) & Human.Funbound.plasma==0)$CASchem1 <- "101-05-3"chem2 <- "2971-36-0"# Take a look at what parameterize_steadystate gives (working from a default fup of 0.005):a1 <- parameterize_steadystate(chem.cas=chem1)a2 <- parameterize_steadystate(chem.cas=chem2)# load Sipes for this chemical:load_sipes2017(chem_include=chem1)# Check values, only fup for the first chemical should change:a3 <- parameterize_steadystate(chem.cas=chem1)a4 <- parameterize_steadystate(chem.cas=chem2)# All tests should be true:a1[["Clint"]] == a3[["Clint"]]a1[["Funbound.plasma"]] != a3[["Funbound.plasma"]]a2[["Clint"]] == a4[["Clint"]]a2[["Funbound.plasma"]] == a4[["Funbound.plasma"]]# load Sipes for this chemical, but allow it to overwrite the clint:load_sipes2017(chem_include=chem1, overwrite=TRUE)# Check values, both clint and fup for the first chemical should change:a5 <- parameterize_steadystate(chem.cas=chem1)a6 <- parameterize_steadystate(chem.cas=chem2)# All tests should be true:a1[["Clint"]] != a5[["Clint"]]a1[["Funbound.plasma"]] != a5[["Funbound.plasma"]]a2[["Clint"]] == a6[["Clint"]]a2[["Funbound.plasma"]] == a6[["Funbound.plasma"]]# Load Sipes for all chemicals, fup should change for second chemical:load_sipes2017()a7 <- parameterize_steadystate(chem.cas=chem1)a8 <- parameterize_steadystate(chem.cas=chem2)# All tests should be true:a1[["Clint"]] != a7[["Clint"]]a1[["Funbound.plasma"]] != a7[["Funbound.plasma"]]a2[["Clint"]] == a8[["Clint"]]a2[["Funbound.plasma"]] != a8[["Funbound.plasma"]]# load Sipes for this chemical, but allow it to overwrite all clints:load_sipes2017(overwrite=TRUE)# Both clint and fup should now be changed for second chemical:a9 <- parameterize_steadystate(chem.cas=chem1)a10 <- parameterize_steadystate(chem.cas=chem2)# All tests should be true:a1[["Clint"]] != a9[["Clint"]]a1[["Funbound.plasma"]] != a9[["Funbound.plasma"]]a2[["Clint"]] != a10[["Clint"]]a2[["Funbound.plasma"]] != a10[["Funbound.plasma"]]Lump tissue parameters into model compartments
Description
This function takes the tissue:plasma partition coefficients frompredict_partitioning_schmitt along with the tissue-specificvolumes and flows and aggregates (or "lumps") themaccording to the needed scheme of toxicokinetic model tissue comparments.
predict_partitioning_schmitt makes tissue-specific predictionsdrawing from those tissues described intissue.data. Sincedifferent physiologically-based toxicokinetic (PBTK) models use diffeent schemes for rganizing thetissues of the body into differing compartments (for example, "rapidlyperfused tissues"), this function lumps tissues intocompartments as specified by the argument 'tissuelist'. Aggregate flows, volumes, and partition coefficients are provided for thelumped tissue compartments. Flows and volumes are summed whilepartition coefficients is calculated using averaging weighted by species-specific tissue volumes.
The name of each entry in 'tissuelist' is its own compartment. Themodelinfo_MODEL.R file corresponding to the model specified by argument'model' includes both a 'tissuelist' describing to the model's compartmentallumping schme as well as a vector of 'tissuenames' specifying all tissues to be lumped into those compartments.
Alternatively the 'tissuelist' and 'tissuenames' can also be manuallyspecified for alternate lumping schemes not necessarily related to apre-made httk model. For example,tissuelist<-list(Rapid=c("Brain","Kidney")).
The tissues contained in 'tissuenames' that are unused in 'tissuelist' are aggregated into a single compartment termed"rest".
NOTE: The partition coefficients of lumped compartments vary according toindividual and species differences since the volumes of the consitutent tissues may vary.
Usage
lump_tissues( Ktissue2pu.in, parameters = NULL, tissuelist = NULL, species = "Human", tissue.vols = NULL, tissue.flows = NULL, tissuenames = NULL, model = "pbtk", suppress.messages = FALSE)Arguments
Ktissue2pu.in | List of partition coefficients from |
parameters | A list of physiological parameters including flows andvolumes for tissues named in |
tissuelist | Manually specifies compartment names and tissues, whichoverride the standard compartment names and tissues that are usuallyspecified in a model's associated modelinfo file. Remaining tissues in themodel's associated |
species | Species desired (either "Rat", "Rabbit", "Dog", "Mouse", ordefault "Human"). |
tissue.vols | A list of volumes for tissues in |
tissue.flows | A list of flows for tissues in |
tissuenames | A list of tissue names in |
model | Specify which model (and therefore which tissues) are being considered. |
suppress.messages | Whether or not the output message is suppressed. |
Value
Krbc2pu | Ratio of concentration of chemical in red blood cellsto unbound concentration in plasma. |
Krest2pu | Ratio of concentrationof chemical in rest of body tissue to unbound concentration in plasma. |
Vrestc | Volume of the rest of the body per kg body weight, L/kg BW. |
Vliverc | Volume of the liver per kg body weight, L/kg BW. |
Qtotal.liverf | Fraction of cardiac output flowing to the gut andliver, i.e. out of the liver. |
Qgutf | Fraction of cardiac outputflowing to the gut. |
Qkidneyf | Fraction of cardiac output flowing tothe kidneys. |
Author(s)
John Wambaugh and Robert Pearce
References
Pearce RG, Setzer RW, Davis JL, Wambaugh JF (2017).“Evaluation and calibration of high-throughput predictions of chemical distribution to tissues.”Journal of pharmacokinetics and pharmacodynamics,44, 549–565.doi:10.1007/s10928-017-9548-7.
See Also
Examples
pcs <- predict_partitioning_schmitt(chem.name='bisphenola') tissuelist <- list( liver=c("liver"), rapid=c("lung","kidney","muscle","brain"), fat=c("adipose"), slow=c('bone')) lump_tissues(pcs,tissuelist=tissuelist)Predict lung mass for children
Description
For individuals under 18, predict the liver mass from height, weight, andgender, using equations from Ogiu et al. 1997
Usage
lung_mass_children(height, weight, gender)Arguments
height | Vector of heights in cm. |
weight | Vector of weights in kg. |
gender | Vector of genders (either 'Male' or 'Female'). |
Value
A vector of lung masses in kg.
Author(s)
Caroline Ring
References
Ogiu, Nobuko, et al. "A statistical analysis of the internal organ weights of normal Japanese people." Health physics 72.3 (1997): 368-383.
Price, Paul S., et al. "Modeling interindividual variation in physiological factors used in PBPK models of humans." Critical reviews in toxicology 33.5 (2003): 469-503.
Ring CL, Pearce RG, Setzer RW, Wetmore BA, Wambaugh JF (2017).“Identifying populations sensitive to environmental chemicals by simulating toxicokinetic variability.”Environment International,106, 105–118.doi:10.1016/j.envint.2017.06.004.
Reference tissue masses and flows from tables in McNally et al. (2014)
Description
Reference tissue masses, flows, and residual variance distributions fromTables 1, 4, and 5 of McNally et al. 2014 (doi:10.1016/j.tox.2013.07.009).
Usage
mcnally_dtFormat
A data.table with variables:
tissueBodytissue
genderGender: Male or Female
mass_refReference mass in kg, from Reference Man
mass_cvCoefficient of variation for mass
mass_distDistribution for mass: Normal or Log-normal
flow_refReference flow in L/h, from Reference Man
flow_cvCoefficient of variation for flow (all normallydistributed)
height_refReference heights (by gender)
CO_refReference cardiac output by gender
flow_fracFraction of CO flowing to each tissue:
flow_ref/CO_ref
Author(s)
Caroline Ring
Source
McNally K, Cotton R, Hogg A, Loizou G (2014).“PopGen: a virtual human population generator.”Toxicology,315, 70–85.
References
McNally K, Cotton R, Hogg A, Loizou G (2014).“PopGen: a virtual human population generator.”Toxicology,315, 70–85.
Ring CL, Pearce RG, Setzer RW, Wetmore BA, Wambaugh JF (2017).“Identifying populations sensitive to environmental chemicals by simulating toxicokinetic variability.”Environment International,106, 105–118.doi:10.1016/j.envint.2017.06.004.
Pre-processed NHANES data.
Description
NHANES data on demographics, anthropometrics, and some laboratory measures,cleaned and combined into a single data set.
Usage
mecdtFormat
A data.table with 23620 rows and 12variables.
- seqn
NHANES unique identifier for individualrespondents.
- sddsrvyr
NHANES two-year cycle: one of "NHANES2013-2014", "NHANES 2015-2016", "NHANES 2017-2018".
- riagendr
Gender:"Male" or "Female"
- ridreth1
Race/ethnicity category: one of "MexicanAmerican", "Non-Hispanic White", "Non-Hispanic Black", "Other", "OtherHispanic".
- ridexagm
Age in months at the time of examination (if notrecorded by NHANES, it was imputed based on age at the time of screening)
- ridexagy
Age in years at the time of examination (if not recorded byNHANES, it was imputed based on age at the time of screening)
- bmxwt
Weight in kg
- lbxscr
Serum creatinine, mg/dL
- lbxhct
Hematocrit, percent by volume of blood composed of red bloodcells
wtmec6yr6-year sample weights for combining 3 cycles,computed by dividing 2-year sample weights by 3.
bmxhtlenavgAverage of height and recumbent length if bothwere measured; if only one was measured, takes value of the one that wasmeasured.
weight_classOne of Underweight, Normal,Overweight, or Obese. Assigned using methods in
get_weight_class.
Author(s)
Caroline Ring
Source
https://wwwn.cdc.gov/nchs/nhanes/Default.aspx
References
Ring CL, Pearce RG, Setzer RW, Wetmore BA, Wambaugh JF (2017).“Identifying populations sensitive to environmental chemicals by simulating toxicokinetic variability.”Environment International,106, 105–118.doi:10.1016/j.envint.2017.06.004.
Monte Carlo for toxicokinetic model parameters
Description
This function performs basic, uncorrelated Monte Carlo to simulateuncertainty and/or variability for parameters of toxicokinetic models. Parameters can be varied according to either anormal distribution that is truncated at zero (using argumentcv.params) or from a normal distribution that is censored for values less than the limit of detection (censored.params). Coefficient of variation (cv) and limit ofof detectin can be specified separately for each parameter.
Usage
monte_carlo( parameters, cv.params = NULL, censored.params = NULL, samples = 1000, suppress.messages = TRUE)Arguments
parameters | These parameters that are also listed in eithercv.params or censored.params are sampled using Monte Carlo. |
cv.params | The parameters listed in cv.params are sampled from anormal distribution that is truncated at zero. This argument should be alist of coefficients of variation (cv) for the normal distribution. Eachentry in the list is named for a parameter in "parameters". New values aresampled with mean equal to the value in "parameters" and standard deviationequal to the mean times the cv. |
censored.params | The parameters listed in censored.params are sampledfrom a normal distribution that is censored for values less than the limitof detection (specified separately for each parameter). This argument shouldbe a list of sub-lists. Each sublist is named for a parameter in "params"and contains two elements: "cv" (coefficient of variation) and "LOD" (limitof detection), below which parameter values are censored. New values aresampled with mean equal to the value in "params" and standard deviationequal to the mean times the cv. Censored values are sampled on a uniformdistribution between 0 and the limit of detection. |
samples | This argument is the number of samples to be generated forcalculating quantiles. |
suppress.messages | Whether or not the output message is suppressed. |
Value
A data.table with a row for each individual in the sample and a column foreach parater in the model.
Author(s)
John Wambaugh
References
Pearce, Robert G., et al. "Httk: R package for high-throughput toxicokinetics." Journal of statistical software 79.4 (2017): 1.
Examples
#Example based on Pearce et al. (2017):# Set up means:params <- parameterize_pbtk(chem.name="zoxamide")# Nothing changes:monte_carlo(params)vary.params <- NULLfor (this.param in names(params)[!(names(params) %in% c("Funbound.plasma", "pKa_Donor", "pKa_Accept" )) & !is.na(as.numeric(params))]) vary.params[this.param] <- 0.2# Most everything varies with CV of 0.2:monte_carlo( parameters=params, cv.params = vary.params)censored.params <- list(Funbound.plasma = list(cv = 0.2, lod = 0.01))# Fup is censored below 0.01:monte_carlo( parameters=params, cv.params = vary.params, censored.params = censored.params)Predict pancreas mass for children
Description
For individuals under 18, predict the pancreas mass from height, weight, andgender, using equations from Ogiu et al.
Usage
pancreas_mass_children(height, weight, gender)Arguments
height | Vector of heights in cm. |
weight | Vector of weights in kg. |
gender | Vector of genders (either 'Male' or 'Female'). |
Value
A vector of pancreas masses in kg.
Author(s)
Caroline Ring
References
Ogiu, Nobuko, et al. "A statistical analysis of the internal organ weights of normal Japanese people." Health physics 72.3 (1997): 368-383.
Ring CL, Pearce RG, Setzer RW, Wetmore BA, Wambaugh JF (2017).“Identifying populations sensitive to environmental chemicals by simulating toxicokinetic variability.”Environment International,106, 105–118.doi:10.1016/j.envint.2017.06.004.
Parameters for a one compartment (empirical) toxicokinetic model
Description
This function initializes the parameters needed in the function solve_1comp.Volume of distribution is estimated by using a modified Schmitt (2008) methodto predict tissue particition coefficients (Pearce et al., 2017) and thenlumping the compartments weighted by tissue volume:
Usage
parameterize_1comp( chem.cas = NULL, chem.name = NULL, dtxsid = NULL, species = "Human", default.to.human = FALSE, adjusted.Funbound.plasma = TRUE, adjusted.Clint = TRUE, regression = TRUE, restrictive.clearance = TRUE, well.stirred.correction = TRUE, suppress.messages = FALSE, clint.pvalue.threshold = 0.05, minimum.Funbound.plasma = 1e-04, class.exclude = TRUE, physchem.exclude = TRUE, Caco2.options = list(), ...)Arguments
chem.cas | Chemical Abstract Services Registry Number (CAS-RN) – the chemical must be identified by either CAS, name, or DTXISD |
chem.name | Chemical name (spaces and capitalization ignored) – the chemical must be identified by either CAS, name, or DTXISD |
dtxsid | EPA's DSSTox Structure ID (https://comptox.epa.gov/dashboard)– the chemical must be identified by either CAS, name, or DTXSIDs |
species | Species desired (either "Rat", "Rabbit", "Dog", "Mouse", ordefault "Human"). |
default.to.human | Substitutes missing rat values with human values iftrue. |
adjusted.Funbound.plasma | Uses Pearce et al. (2017) lipid binding adjustmentfor Funbound.plasma (which impacts volume of distribution) when set to TRUE (Default). |
adjusted.Clint | Uses Kilford et al. (2008) hepatocyte incubationbinding adjustment for Clint when set to TRUE (Default). |
regression | Whether or not to use the regressions in calculatingpartition coefficients in volume of distribution calculation. |
restrictive.clearance | In calculating elimination rate and hepaticbioavailability, protein binding is not taken into account (set to 1) inliver clearance if FALSE. |
well.stirred.correction | Uses correction in calculation of hepaticclearance for well-stirred model if TRUE. This assumes clearance relativeto amount unbound in whole blood instead of plasma, but converted to usewith plasma concentration. |
suppress.messages | Whether or not to suppress messages. |
clint.pvalue.threshold | Hepatic clearance for chemicals where the invitro clearance assay result has a p-value greater than the threshold areset to zero. |
minimum.Funbound.plasma | Monte Carlo draws less than this value are set equal to this value (default is 0.0001 – half the lowest measured Fup in ourdataset). |
class.exclude | Exclude chemical classes identified as outside of domain of applicability by relevant modelinfo_[MODEL] file (default TRUE). |
physchem.exclude | Exclude chemicals on the basis of physico-chemicalproperties (currently only Henry's law constant) as specified by the relevant modelinfo_[MODEL] file (default TRUE). |
Caco2.options | A list of options to use when working with Caco2 apical to basolateral data |
... | Additional arguments, not currently used. |
Details
V_d,steady-state = Sum over all tissues (K_i * V_i) + V_plasma
where K_i is the tissue:unbound plasma concentration partition coefficientfor tissue i.
Because this model does not simulate exhalation, inhalation, and other processes relevant to volatile chemicals, this model is by default restricted to chemicals with a logHenry's Law Constant less than that of Acetone, a known volatile chemical. That is, chemicals with logHLC > -4.5 (Log10 atm-m3/mole) are excluded. Volatility is not purely determined by the Henry's Law Constant, therefore this chemical exclusion may be turned off with the argument "physchem.exclude = FALSE". Similarly, per- and polyfluoroalkyl substances (PFAS) are excluded by default because the transporters that often drive PFAS toxicokinetics are not included in this model. However, PFAS chemicals can be included with the argument "class.exclude = FALSE".
Value
Vdist | Volume of distribution, units of L/kg BW. |
Fabsgut | Fraction of the oral dose absorbed and surviving gut metabolism, i.e. the fraction of the dose that enters the gutlumen. |
kelim | Elimination rate, units of1/h. |
hematocrit | Percent volume of red blood cells in the blood. |
Fabsgut | Fraction of the oral dose absorbed, i.e. the fraction of thedose that enters the gutlumen. |
Fhep.assay.correction | The fraction of chemical unbound in hepatocyte assay using the method of Kilford et al. (2008) |
kelim | Elimination rate, units of 1/h. |
hematocrit | Percent volume of red blood cells in the blood. |
kgutabs | Rate chemical is absorbed, 1/h. |
million.cells.per.gliver | Millions cells per gram of liver tissue. |
MW | Molecular Weight, g/mol. |
Rblood2plasma | The ratio of the concentration of the chemical in the blood to the concentration in the plasma. Not used in calculations but included for the conversion of plasma outputs. |
hepatic.bioavailability | Fraction of dose remaining afterfirst pass clearance, calculated from the corrected well-stirred model. |
BW | Body Weight, kg. |
Author(s)
John Wambaugh and Robert Pearce
References
Pearce RG, Setzer RW, Strope CL, Wambaugh JF, Sipes NS (2017).“Httk: R package for high-throughput toxicokinetics.”Journal of Statistical Software,79(4), 1.doi:10.18637/jss.v079.i04.
Schmitt W (2008).“General approach for the calculation of tissue to plasma partition coefficients.”Toxicology in vitro,22(2), 457–467.doi:10.1016/j.tiv.2007.09.010.
Pearce RG, Setzer RW, Davis JL, Wambaugh JF (2017).“Evaluation and calibration of high-throughput predictions of chemical distribution to tissues.”Journal of pharmacokinetics and pharmacodynamics,44, 549–565.doi:10.1007/s10928-017-9548-7.
Kilford PJ, Gertz M, Houston JB, Galetin A (2008).“Hepatocellular binding of drugs: correction for unbound fraction in hepatocyte incubations using microsomal binding or drug lipophilicity data.”Drug Metabolism and Disposition,36(7), 1194–1197.doi:10.1124/dmd.108.020834.
See Also
Examples
parameters1 <- parameterize_1comp(chem.name='Bisphenol-A',species='Rat') parameters2 <- parameterize_1comp(chem.cas='80-05-7', restrictive.clearance=FALSE, species='rabbit', default.to.human=TRUE)# The following will not work because Diquat dibromide monohydrate's # Henry's Law Constant (-3.912) is higher than that of Acetone (~-4.5):try(parameters3 <- parameterize_1comp(chem.cas = "6385-62-2"))# However, we can turn off checking for phys-chem properties, since we know# that Diquat dibromide monohydrate is not too volatile:parameters3 <- parameterize_1comp(chem.cas = "6385-62-2", physchem.exclude = FALSE)out <- solve_1comp(parameters=parameters1, days=1)Parameterize_1tri_PBTK
Description
This function initializes the parameters needed in the functionssolve_1tri_pbtk by calling parameterize_pbtk and adding additional parameters.
Usage
parameterize_1tri_pbtk( chem.cas = NULL, chem.name = NULL, dtxsid = NULL, species = "Human", return.kapraun2019 = TRUE, suppress.messages = FALSE, ...)Arguments
chem.cas | Either the chemical name or the CAS number must bespecified. |
chem.name | Either the chemical name or the CAS number must bespecified. |
dtxsid | EPA's DSSTox Structure ID (https://comptox.epa.gov/dashboard)the chemical must be identified by either CAS, name, or DTXSIDs |
species | Species desired (either "Rat", "Rabbit", "Dog", "Mouse", ordefault "Human"). Currently only a human model is supported. |
return.kapraun2019 | If TRUE (default), empirical parameters from Kapraun et al. (2019) necessary for defining the model are provided.This is a subset of the httk::kapraun2019 list object with additional parameters. |
suppress.messages | Whether or not the output message is suppressed. |
... | Arguments passed to parameterize_pbtk. |
Details
Because this model does not simulate exhalation, inhalation, and other processes relevant to volatile chemicals, this model is by default restricted to chemicals with a logHenry's Law Constant less than that of Acetone, a known volatile chemical. That is, chemicals with logHLC > -4.5 (Log10 atm-m3/mole) are excluded. Volatility is not purely determined by the Henry's Law Constant, therefore this chemical exclusion may be turned off with the argument "physchem.exclude = FALSE". Similarly, per- and polyfluoroalkyl substances (PFAS) are excluded by default because the transporters that often drive PFAS toxicokinetics are not included in this model. However, PFAS chemicals can be included with the argument "class.exclude = FALSE".
Value
pre_pregnant_BW | Body Weight before pregnancy, kg. |
Clmetabolismc | Hepatic Clearance, L/h/kg BW. |
Fabsgut | Fraction of the oral dose absorbed, i.e. the fraction of the dose that enters the gutlumen. |
Funbound.plasma | Fraction of plasma that is not bound. |
Fhep.assay.correction | The fraction of chemical unbound in hepatocyteassay using the method of Kilford et al. (2008) |
hematocrit | Percent volume of red blood cells in the blood. |
Kadipose2pu | Ratio of concentration of chemical in adipose tissue to unbound concentration in plasma. |
Kconceptus2pu_initial | Ratio of concentration of chemical in "conceptus" compartment to unbound concentration in plasma at time 0. |
Kconceptus2pu_final | Ratio of concentration of chemical in "conceptus" compartment to unbound concentration in plasma at 13 weeks. |
Kgut2pu | Ratio of concentration of chemical in gut tissue to unbound concentration in plasma. |
kgutabs | Rate that chemical enters the gut from gutlumen, 1/h. |
Kkidney2pu | Ratio of concentration of chemical in kidney tissue to unbound concentration in plasma. |
Kliver2pu | Ratio of concentration of chemical in liver tissue to unbound concentration in plasma. |
Klung2pu | Ratio of concentration of chemical in lung tissue to unboundconcentration in plasma. |
Krbc2pu | Ratio of concentration of chemical in red blood cells to unbound concentration in plasma. |
Krest2pu | Ratio of concentration of chemical in rest of body tissue tounbound concentration in plasma. |
Kthyroid2pu | Ratio of concentration of chemical in thyroid tissue to unbound concentration in plasma. |
million.cells.per.gliver | Millions cells per gram of liver tissue. |
MW | Molecular Weight, g/mol. |
pH_Plasma_mat | pH of the maternal plasma. |
Qgfr | Glomerular Filtration Rate, L/h/kg BW^3/4, volume of fluidfiltered from kidney and excreted. |
Vgutc | Volume of the gut per kg body weight, L/kg BW. |
Vkidneyc | Volume of the kidneys per kg body weight, L/kg BW. |
Vliverc | Volume of the liver per kg body weight, L/kg BW. |
Vlungc | Volume of the lungs per kg body weight, L/kg BW. |
Vthyroidc | Volume of the thyroid per kg body weight, L/kg BW. |
Author(s)
Kimberly Truong, Mark Sfeir, Dustin Kapraun, John Wambaugh
References
Kilford PJ, Gertz M, Houston JB, Galetin A (2008).“Hepatocellular binding of drugs: correction for unbound fraction in hepatocyte incubations using microsomal binding or drug lipophilicity data.”Drug Metabolism and Disposition,36(7), 1194–1197.doi:10.1124/dmd.108.020834.
Kapraun DF, Wambaugh JF, Setzer RW, Judson RS (2019).“Empirical models for anatomical and physiological changes in a human mother and fetus during pregnancy and gestation.”PLOS ONE,14(5), 1-56.doi:10.1371/journal.pone.0215906.
Kapraun DF, Sfeir M, Pearce RG, Davidson-Fritz SE, Lumen A, Dallmann A, Judson RS, Wambaugh JF (2022).“Evaluation of a rapid, generic human gestational dose model.”Reproductive Toxicology,113, 172–188.doi:10.1016/j.reprotox.2022.09.004.
Truong KT, Wambaugh JF, Kapraun DF, Davidson-Fritz SE, Eytcheson S, Judson RS, Paul Friedman K (2025).“Interpretation of thyroid-relevant bioactivity data for comparison to in vivo exposures: A prioritization approach for putative chemical inhibitors of in vitro deiodinase activity.”Toxicology.doi:10.1016/j.tox.2025.154157.
See Also
Examples
parameters <- parameterize_1tri_pbtk(dtxsid = "DTXSID7020182") parameters <- parameterize_1tri_pbtk(chem.name='Bisphenol-A')Parameters for a three-compartment toxicokinetic model (dynamic)
Description
This function generates the chemical- and species-specific parameters needed for model '3compartment', for examplesolve_3comp. A call is masde toparameterize_pbtk to use Schmitt (2008)'s methodas modified by Pearce et al. (2017) to predict partition coefficients basedon descriptions intissue.data. Organ volumes and flows areretrieved from tablephysiology.data.
Usage
parameterize_3comp( chem.cas = NULL, chem.name = NULL, dtxsid = NULL, species = "Human", default.to.human = FALSE, class.exclude = TRUE, physchem.exclude = TRUE, force.human.clint.fup = FALSE, clint.pvalue.threshold = 0.05, adjusted.Funbound.plasma = TRUE, adjusted.Clint = TRUE, regression = TRUE, suppress.messages = FALSE, restrictive.clearance = TRUE, minimum.Funbound.plasma = 1e-04, Caco2.options = NULL, ...)Arguments
chem.cas | Chemical Abstract Services Registry Number (CAS-RN) – the chemical must be identified by either CAS, name, or DTXISD |
chem.name | Chemical name (spaces and capitalization ignored) – the chemical must be identified by either CAS, name, or DTXISD |
dtxsid | EPA's 'DSSTox Structure ID (https://comptox.epa.gov/dashboard)– the chemical must be identified by either CAS, name, or DTXSIDs |
species | Species desired (either "Rat", "Rabbit", "Dog", "Mouse", ordefault "Human"). |
default.to.human | Substitutes missing animal values with human valuesif true. |
class.exclude | Exclude chemical classes identified as outside of domain of applicability by relevant modelinfo_[MODEL] file (default TRUE). |
physchem.exclude | Exclude chemicals on the basis of physico-chemicalproperties (currently only Henry's law constant) as specified by the relevant modelinfo_[MODEL] file (default TRUE). |
force.human.clint.fup | Forces use of human values for hepaticintrinsic clearance and fraction of unbound plasma if true. |
clint.pvalue.threshold | Hepatic clearances with clearance assayshaving p-values greater than the threshold are set to zero. |
adjusted.Funbound.plasma | Uses Pearce et al. (2017) lipid binding adjustmentfor Funbound.plasma (which impacts partition coefficients) when set to TRUE (Default). |
adjusted.Clint | Uses Kilford et al. (2008) hepatocyte incubationbinding adjustment for Clint when set to TRUE (Default). |
regression | Whether or not to use the regressions in calculatingpartition coefficients. |
suppress.messages | Whether or not the output message is suppressed. |
restrictive.clearance | In calculating hepatic.bioavailability, proteinbinding is not taken into account (set to 1) in liver clearance if FALSE. |
minimum.Funbound.plasma | Monte Carlo draws less than this value are set equal to this value (default is 0.0001 – half the lowest measured Fup in ourdataset). |
Caco2.options | A list of options to use when working with Caco2 apical to basolateral data |
... | Additional arguments, not currently used. |
Details
Because this model does not simulate exhalation, inhalation, and other processes relevant to volatile chemicals, this model is by default restricted to chemicals with a logHenry's Law Constant less than that of Acetone, a known volatile chemical. That is, chemicals with logHLC > -4.5 (Log10 atm-m3/mole) are excluded. Volatility is not purely determined by the Henry's Law Constant, therefore this chemical exclusion may be turned off with the argument "physchem.exclude = FALSE". Similarly, per- and polyfluoroalkyl substances (PFAS) are excluded by default because the transporters that often drive PFAS toxicokinetics are not included in this model. However, PFAS chemicals can be included with the argument "class.exclude = FALSE".
Value
BW | Body Weight, kg. |
Clmetabolismc | Hepatic Clearance, L/h/kg BW. |
Fabsgut | Fraction of the oral dose absorbed, i.e. the fraction of the dose that enters the gutlumen. |
Funbound.plasma | Fraction of plasma that is not bound. |
Fhep.assay.correction | The fraction of chemical unbound in hepatocyte assay using the method of Kilford et al. (2008) |
hematocrit | Percent volume of red blood cells in the blood. |
Kgut2pu | Ratio of concentration of chemical in gut tissue to unboundconcentration in plasma. |
Kliver2pu | Ratio of concentration ofchemical in liver tissue to unbound concentration in plasma. |
Krbc2pu | Ratio of concentration of chemical in red blood cells tounbound concentration in plasma. |
Krest2pu | Ratio of concentration ofchemical in rest of body tissue to unbound concentration in plasma. |
million.cells.per.gliver | Millions cells per gram of liver tissue. |
MW | Molecular Weight, g/mol. |
Qcardiacc | Cardiac Output, L/h/kgBW^3/4. |
Qgfrc | Glomerular Filtration Rate, L/h/kg BW^3/4, volume offluid filtered from kidney and excreted. |
Qgutf | Fraction of cardiac output flowing to the gut. |
Qliverf | Fraction of cardiac output flowing to the liver. |
Rblood2plasma | The ratio of the concentrationof the chemical in the blood to the concentration in the plasma. |
Vgutc | Volume of the gut per kg body weight, L/kg BW. |
Vliverc | Volume of the liver per kg body weight, L/kg BW. |
Vrestc | Volume of the rest of the body per kg body weight, L/kg BW. |
Author(s)
Robert Pearce and John Wambaugh
References
Pearce RG, Setzer RW, Strope CL, Wambaugh JF, Sipes NS (2017).“Httk: R package for high-throughput toxicokinetics.”Journal of Statistical Software,79(4), 1.doi:10.18637/jss.v079.i04.
Schmitt W (2008).“General approach for the calculation of tissue to plasma partition coefficients.”Toxicology in vitro,22(2), 457–467.doi:10.1016/j.tiv.2007.09.010.
Pearce RG, Setzer RW, Davis JL, Wambaugh JF (2017).“Evaluation and calibration of high-throughput predictions of chemical distribution to tissues.”Journal of pharmacokinetics and pharmacodynamics,44, 549–565.doi:10.1007/s10928-017-9548-7.
Kilford PJ, Gertz M, Houston JB, Galetin A (2008).“Hepatocellular binding of drugs: correction for unbound fraction in hepatocyte incubations using microsomal binding or drug lipophilicity data.”Drug Metabolism and Disposition,36(7), 1194–1197.doi:10.1124/dmd.108.020834.
Wambaugh JF, Schacht CM, Ring CL (2025).“A Simple Physiologically Based Toxicokinetic Model for Multi-Route In Vitro–In Vivo Extrapolation.”Environmental Science & Technology Letters,12(3), 261–268.doi:10.1021/acs.estlett.4c00967.
See Also
Examples
parameters1 <- parameterize_3comp(chem.name='Bisphenol-A',species='Rat')parameters2 <- parameterize_3comp(chem.cas='80-05-7', species='rabbit',default.to.human=TRUE)# The following will not work because Diquat dibromide monohydrate's # Henry's Law Constant (-3.912) is higher than that of Acetone (~-4.5):try(parameters3 <- parameterize_3comp(chem.cas = "6385-62-2"))# However, we can turn off checking for phys-chem properties, since we know# that Diquat dibromide monohydrate is not too volatile:parameters3 <- parameterize_3comp(chem.cas = "6385-62-2", physchem.exclude = FALSE)out <- solve_3comp(parameters=parameters1, plots=TRUE)Parameters for a three-compartment toxicokinetic model (dynamic)
Description
This function generates the chemical- and species-specific parameters needed for model '3compartment', for examplesolve_3comp. A call is masde toparameterize_pbtk to use Schmitt (2008)'s methodas modified by Pearce et al. (2017) to predict partition coefficients basedon descriptions intissue.data. Organ volumes and flows areretrieved from tablephysiology.data.
Usage
parameterize_3comp2( chem.cas = NULL, chem.name = NULL, dtxsid = NULL, species = "Human", default.to.human = FALSE, physchem.exclude = TRUE, class.exclude = TRUE, force.human.clint.fup = FALSE, clint.pvalue.threshold = 0.05, adjusted.Funbound.plasma = TRUE, adjusted.Clint = TRUE, regression = TRUE, suppress.messages = FALSE, restrictive.clearance = TRUE, minimum.Funbound.plasma = 1e-04, Caco2.options = NULL, ...)Arguments
chem.cas | Chemical Abstract Services Registry Number (CAS-RN) – the chemical must be identified by either CAS, name, or DTXISD |
chem.name | Chemical name (spaces and capitalization ignored) – the chemical must be identified by either CAS, name, or DTXISD |
dtxsid | EPA's 'DSSTox Structure ID (https://comptox.epa.gov/dashboard)– the chemical must be identified by either CAS, name, or DTXSIDs |
species | Species desired (either "Rat", "Rabbit", "Dog", "Mouse", ordefault "Human"). |
default.to.human | Substitutes missing animal values with human valuesif true. |
physchem.exclude | Exclude chemicals on the basis of physico-chemicalproperties (currently only Henry's law constant) as specified by the relevant modelinfo_[MODEL] file (default TRUE). |
class.exclude | Exclude chemical classes identified as outside of domain of applicability by relevant modelinfo_[MODEL] file (default TRUE). |
force.human.clint.fup | Forces use of human values for hepaticintrinsic clearance and fraction of unbound plasma if true. |
clint.pvalue.threshold | Hepatic clearances with clearance assayshaving p-values greater than the threshold are set to zero. |
adjusted.Funbound.plasma | Uses Pearce et al. (2017) lipid binding adjustmentfor Funbound.plasma (which impacts partition coefficients) when set to TRUE (Default). |
adjusted.Clint | Uses Kilford et al. (2008) hepatocyte incubationbinding adjustment for Clint when set to TRUE (Default). |
regression | Whether or not to use the regressions in calculatingpartition coefficients. |
suppress.messages | Whether or not the output message is suppressed. |
restrictive.clearance | In calculating hepatic.bioavailability, proteinbinding is not taken into account (set to 1) in liver clearance if FALSE. |
minimum.Funbound.plasma | Monte Carlo draws less than this value are set equal to this value (default is 0.0001 – half the lowest measured Fup in ourdataset). |
Caco2.options | A list of options to use when working with Caco2 apical to basolateral data |
... | Additional arguments are passed to |
Details
Per- and polyfluoroalkyl substances (PFAS) are excluded by default because the transporters that often drive PFAS toxicokinetics are not included in this model. However, PFAS chemicals can be included with the argument "class.exclude = FALSE".
Value
BW | Body Weight, kg. |
Clmetabolismc | Hepatic Clearance, L/h/kg BW. |
Fabsgut | Fraction of the oral dose absorbed, i.e. the fraction of the dose that enters the gutlumen. |
Funbound.plasma | Fraction of plasma that is not bound. |
Fhep.assay.correction | The fraction of chemical unbound in hepatocyte assay using the method of Kilford et al. (2008) |
hematocrit | Percent volume of red blood cells in the blood. |
Kgut2pu | Ratio of concentration of chemical in gut tissue to unboundconcentration in plasma. |
Kliver2pu | Ratio of concentration ofchemical in liver tissue to unbound concentration in plasma. |
Krbc2pu | Ratio of concentration of chemical in red blood cells tounbound concentration in plasma. |
Krest2pu | Ratio of concentration ofchemical in rest of body tissue to unbound concentration in plasma. |
million.cells.per.gliver | Millions cells per gram of liver tissue. |
MW | Molecular Weight, g/mol. |
Qcardiacc | Cardiac Output, L/h/kgBW^3/4. |
Qgfrc | Glomerular Filtration Rate, L/h/kg BW^3/4, volume offluid filtered from kidney and excreted. |
Qgutf | Fraction of cardiac output flowing to the gut. |
Qliverf | Fraction of cardiac output flowing to the liver. |
Rblood2plasma | The ratio of the concentrationof the chemical in the blood to the concentration in the plasma. |
Vgutc | Volume of the gut per kg body weight, L/kg BW. |
Vliverc | Volume of the liver per kg body weight, L/kg BW. |
Vrestc | Volume of the rest of the body per kg body weight, L/kg BW. |
Author(s)
John Wambaugh
References
Pearce RG, Setzer RW, Strope CL, Wambaugh JF, Sipes NS (2017).“Httk: R package for high-throughput toxicokinetics.”Journal of Statistical Software,79(4), 1.doi:10.18637/jss.v079.i04.
Schmitt W (2008).“General approach for the calculation of tissue to plasma partition coefficients.”Toxicology in vitro,22(2), 457–467.doi:10.1016/j.tiv.2007.09.010.
Pearce RG, Setzer RW, Davis JL, Wambaugh JF (2017).“Evaluation and calibration of high-throughput predictions of chemical distribution to tissues.”Journal of pharmacokinetics and pharmacodynamics,44, 549–565.doi:10.1007/s10928-017-9548-7.
Kilford PJ, Gertz M, Houston JB, Galetin A (2008).“Hepatocellular binding of drugs: correction for unbound fraction in hepatocyte incubations using microsomal binding or drug lipophilicity data.”Drug Metabolism and Disposition,36(7), 1194–1197.doi:10.1124/dmd.108.020834.
Wambaugh JF, Schacht CM, Ring CL (2025).“A Simple Physiologically Based Toxicokinetic Model for Multi-Route In Vitro–In Vivo Extrapolation.”Environmental Science & Technology Letters,12(3), 261–268.doi:10.1021/acs.estlett.4c00967.
See Also
Examples
parameters <- parameterize_3comp2(chem.name='Bisphenol-A',species='Rat') parameters <- parameterize_3comp2(chem.cas='80-05-7', species='rabbit',default.to.human=TRUE) out <- solve_3comp2(parameters=parameters,plots=TRUE)Parameterize In Vitro Distribution Models
Description
This function collects physicochemical properties from chemicals input by the user for use with armitage.R and kramer.R.
Usage
parameterize_IVD(tcdata = NA, casrn.vector = NA_character_, this.pH = 7)Arguments
tcdata | A data.table with casrn, nomconc, MP, gkow, gkaw, gswat, sarea,v_total, v_working. Otherwise supply single values to this.params (e.g., this.sarea,this.v_total, etc.). Chemical parameters are taken from |
casrn.vector | For vector or single value, CAS number |
this.pH | pH of media |
Value
| Param | Description | Units |
| casrn | Chemical Abstracts Service Registry Number | character |
| logHenry | The log10 Henry's law constant | atm*m^3/mol |
| gswat | The log10 water solubility at 25C (logWSol) | log10 mol/L |
| MP_C | The chemical compound's melting point | degrees C |
| MW | The chemical compound's molecular weight | g/mol |
| gkow_n | The log10 octanol to water (PC) (logP) | log10 unitless ratio |
| pKa_Donor | Chemical dissociation equilibrium constant(s); pKa(ie pKa_Donor) = -log10(Ka) | unitless |
| pKa_Accept | Chemical association equilibrium constant(s); pKb(ie pKa_Accept) = 14 - pKa | unitless |
| pH | pH where ionization is evaluated (typically assay medium) | unitless |
| gkaw_n | The air to water PC (neutral) | unitless ratio |
Author(s)
Meredith Scherer
Examples
library(httk)output <- parameterize_IVD(casrn.vector = c("15687-27-1"))print(output)Parameterize Armitage In Vitro Distribution Model
Description
Parameterize Armitage In Vitro Distribution Model
Usage
parameterize_armitage(tcdata = NA, casrn.vector = NA_character_)Arguments
tcdata | A data.table with casrn, nomconc, MP, gkow, gkaw, gswat, sarea,v_total, v_working. Otherwise supply single values to this.params (e.g., this.sarea,this.v_total, etc.). Chemical parameters are taken from |
casrn.vector | A deprecated argument specifying a single or vector of Chemical Abstracts Service Registry Number(s) (CAS-RN) of desired chemical(s). |
Value
| Param | Description | Units |
| casrn | Chemical Abstracts Service Registry Number | character |
| logHenry | The log10 Henry's law constant | atm*m^3/mol |
| MP_C | The chemical compound's melting point | degrees C |
| MW | The chemical compound's molecular weight | g/mol |
| gkow_n | The log10 octanol to water (PC) (logP) | log10 unitless ratio |
| pKa_Donor | Chemical dissociation equilibrium constant(s); pKa(ie pKa_Donor) = -log10(Ka) | unitless |
| pKa_Accept | Chemical association equilibrium constant(s); pKb(ie pKa_Accept) = 14 - pKa | unitless |
| pH | pH where ionization is evaluated (typically assay medium) | unitless |
| gkaw_n | The air to water PC (neutral) | unitless ratio |
| gswat_n | The log10 water solubility at 25C (logWSol) | log10 mg/L |
Author(s)
Meredith Scherer
References
Armitage JM, Wania F, Arnot JA (2014).“Application of mass balance models and the chemical activity concept to facilitate the use of in vitro toxicity data for risk assessment.”Environmental science & technology,48(16), 9770–9779.doi:10.1021/es501955g.
Parameterizea generic PBTK model with dermal exposure
Description
This function initializes the parameters needed in the functions solve_dermal_pbtk.
Usage
parameterize_dermal_pbtk( chem.cas = NULL, chem.name = NULL, dtxsid = NULL, model.type = "dermal_1subcomp", method.permeability = "UK-Surrey", species = "Human", default.to.human = FALSE, tissuelist = list(liver = c("liver"), kidney = c("kidney"), lung = c("lung"), gut = c("gut"), skin = c("skin")), force.human.clint.fup = FALSE, clint.pvalue.threshold = 0.05, adjusted.Funbound.plasma = TRUE, adjusted.Clint = TRUE, regression = TRUE, suppress.messages = FALSE, restrictive.clearance = TRUE, minimum.Funbound.plasma = 1e-04, skin_depth = 0.12, skin.pH = 7, BW = NULL, height = 175, totalSA = NULL, Kvehicle2water = "water", InfiniteDose = 0, million.cells.per.gliver = 110, liver.density = 1.05, kgutabs = 2.18, Caco2.options = NULL)Arguments
chem.cas | Either the chemical name or the CAS number must bespecified. |
chem.name | Either the chemical name or the CAS number must bespecified. Parameters include tissue:plasma partition coefficients, organ volumes, and flows for the tissue lumping scheme specified by argument tissuelist.Tissure:(fraction unbound in) plasma partitition coefficients are predictedvia Schmitt (2008)'s method as modified by Pearce et al. (2017) using By default, this function initializes the parameters needed in the functions The default PBTK model includes an explicit first pass of the chemical throughthe liver before it becomes available to systemic blood. We model systemic oral bioavailability as Fbio=Fabs*Fgut*Fhep.Only if Fbiohas been measured in vivo and is found intable |
dtxsid | EPA's DSSTox Structure ID (https://comptox.epa.gov/dashboard)the chemical must be identified by either CAS, name, or DTXSIDs. |
model.type | Choice of dermal model, either the default "dermal_1subcomp" forthe model with 1 compartment for the skin; or (not usable yet) "dermal" for the model with 2 sub compartments (a sc and ed layer) for skin which defaults to the sc layer being the stratum corneum and the ed layer being the combinedviable epidermis and dermis. |
method.permeability | For "dermal_1subcomp" model, method of calculating the permeability coefficient, P, either "Potts-Guy" or "UK-Surrey". Default is "UK-Surrey" (Sawyer et al., 2016 and Chen et al., 2015), which uses Fick'slaw of diffusion to calculate P. For "dermal" model, this parameter is ignored. |
species | Species desired (either "Rat", "Rabbit", "Dog", "Mouse", ordefault "Human"). |
default.to.human | Substitutes missing animal values with human valuesif true (hepatic intrinsic clearance or fraction of unbound plasma). |
tissuelist | Specifies compartment names and tissues groupings.Remaining tissues in tissue.data are lumped in the rest of the body.However, |
force.human.clint.fup | Forces use of human values for hepaticintrinsic clearance and fraction of unbound plasma if true. |
clint.pvalue.threshold | Hepatic clearance for chemicals where the invitro clearance assay result has a p-values greater than the threshold areset to zero. |
adjusted.Funbound.plasma | Uses Pearce et al. (2017) lipid binding adjustmentfor Funbound.plasma (which impacts partition coefficients) when set to TRUE (Default). |
adjusted.Clint | Uses Kilford et al. (2008) hepatocyte incubationbinding adjustment for Clint when set to TRUE (Default). |
regression | Whether or not to use the regressions in calculatingpartition coefficients. |
suppress.messages | Whether or not the output message is suppressed. |
restrictive.clearance | In calculating hepatic.bioavailability, proteinbinding is not taken into account (set to 1) in liver clearance if FALSE. |
minimum.Funbound.plasma | Monte Carlo draws less than this value are set equal to this value (default is 0.0001 – half the lowest measured Fup in ourdataset). |
skin_depth | skin_depth of skin, cm, used in calculating P. |
skin.pH | pH of dermis/skin, used in calculating P and Kskin2vehicle. |
BW | Body weight (kg) |
height | Height in cm, used in calculating totalSA. |
totalSA | Total body surface area (cm^2) |
Kvehicle2water | Partition coefficient for the vehicle (sometimes called the vehicle) carrying the chemical to water. Default is "water", which assumes the vehicle is water.Other optional inputs are "octanol", "olive oil", or a numeric value. |
InfiniteDose | If TRUE, we assume infinite dosing (i.e., a constant unchanging concentrationof chemical in the vehicle is considered) and Cvehicle is a constant. IfFALSE (default), dosing is finite and Cvehicle changes over time. |
million.cells.per.gliver | Hepatocellularity (defaults to 110 10^6 cells/g-liver, from Carlile et al. (1997)) |
liver.density | Liver density (defaults to 1.05 g/mL from International Commission on Radiological Protection (1975)) |
kgutabs | Oral absorption rate from gut (defaults to 2.18 1/h from Wambaugh et al. (2018)) |
Caco2.options | A list of options to use when working with Caco2 apical tobasolateral data |
Value
BW | Body Weight, kg. |
Clmetabolismc | Hepatic Clearance, L/h/kg BW. |
Fgutabs | Fraction of the oral dose absorbed, i.e. the fraction ofthe dose that enters the gutlumen. |
Fhep.assay.correction | The fraction of chemical unbound in hepatocyte assay using the method of Kilford et al.(2008) |
Fskin_depth_sc | Fraction of skin depth in strateum corneum so that the depthof the SC is Fskin_depth_sc*skin_depth. This parameter does not appear when model.type="dermal_1subcomp". |
Fskin_depth_ed | Fraction of skin depth in combined viable epidermis anddermis so that the depth of the ED is Fskin_depth_ed*skin_depth. This parameter does not appear when model.type="dermal_1subcomp". |
Fskin_exposed | Fraction of skin exposed. |
Funbound.plasma | Fraction of plasma that is not bound. |
hematocrit | Percent volume of red blood cells in the blood. |
InfiniteDose | If InfiniteDose=1, infinite dosing is assumed and Cvehicle_infiniteis used in place of Cvehicle; if InfiniteDose=0, finite dosing is assumed andAvehicle is used for dosing. When InfiniteDose=1, the state variable Avehicle does not have meaning. |
Kblood2air | Ratio of concentration of chemical in blood to air, calculatedusing calc_kair. |
Kgut2pu | Ratio of concentration of chemical in gut tissue to unboundconcentration in plasma. |
kgutabs | Rate that chemical enters the gut from gutlumen, 1/h. |
Kkidney2pu | Ratio of concentration of chemical inkidney tissue to unbound concentration in plasma. |
Kliver2pu | Ratio of concentration of chemical in liver tissue to unbound concentration in plasma. |
Klung2pu | Ratio of concentration of chemical in lung tissueto unbound concentration in plasma. |
Krbc2pu | Ratio of concentration of chemical in red blood cells to unbound concentration in plasma. |
Krest2pu | Ratio of concentration of chemical in rest of body tissue tounbound concentration in plasma. |
Kskin2pu | Ratio of concentration of chemical in skin tissue tounbound concentration in plasma. |
Kskin2vehicle | Partition coefficient between exposed skin and vehicle. This parameter only appears when model.type="dermal_1subcomp"and is replaced by Ksc2vehicle when model.type="dermal". |
Ksc2vehicle | Partition coefficient between SC and vehicle. This parameter does not appear when model.type="dermal_1subcomp". |
Ksc2ed | Partition coefficient between ED andSC. This parameter does not appear when model.type="dermal_1subcomp". |
MA | ? |
million.cells.per.gliver | Millions cells per gram of liver tissue. |
MW | Molecular Weight, g/mol. |
P | Permeability of the skin, cm/h. When model.type="dermal_1subcomp", this parameter changes depending on method.permeability. When model.type="dermal",this parameter is replaced by Pvehicle2sc and Psc2ed. |
Pvehicle2sc | Permeabilityof the stratum corneum (SC), cm/h. This parameter does not appear when model.type="dermal_1subcomp". |
Psc2ed | Permeability of the combined viable epidermis and dermis layer of the skin ("ed"), cm/h.This parameter does not appear when model.type="dermal_1subcomp". |
Qalvc | Unscaled alveolar ventilation rate, L/h/kg BW^3/4. |
Qcardiacc | Cardiac Output, L/h/kg BW^3/4. |
Qgfrc | Glomerular Filtration Rate, L/h/kg BW^3/4, volume of fluid filtered from kidney and excreted. |
Qgutf | Fraction of cardiac output flowing to the gut. |
Qkidneyf | Fraction of cardiac output flowing to the kidneys. |
Qliverf | Fraction of cardiac output flowing to the liver. |
Qlungf | Fraction of cardiac output flowing to the lung. |
Qskinf | Fraction of cardiac output flowing to the skin, or to the edlayer of the skin when model.type="dermal". |
Rblood2plasma | The ratio of the concentration of the chemical in theblood to the concentration in the plasma from available_rblood2plasma. |
skin_depth | Skin depth, cm. |
totalSA | Total body surface area, cm^2. |
Vartc | Volume of the arteries per kg body weight, L/kg BW. |
Vgutc | Volume of the gut per kg body weight, L/kg BW. |
Vkidneyc | Volume of the kidneys per kg body weight, L/kg BW. |
Vliverc | Volume of the liver per kg body weight, L/kg BW. |
Vlungc | Volume of the lungs per kg body weight, L/kg BW. |
Vrestc | Volume of the rest of the body per kg body weight, L/kg BW. |
Vvenc | Volume of the veins per kg body weight, L/kg BW. |
Vskinc | Volume of the skin per kg body weight, L/kg BW. |
Vskin_scc | Volume of the sc or upper layer of the skin per kg body weight, L/kg BW. This parameter does not appear when model.type="dermal_1subcomp". |
Vskin_edc | Volume of the combined viable epidermis and dermis layer of the skin per kg body weight, L/kg BW. This parameter does not appear when model.type="dermal_1subcomp". |
Author(s)
Annabel Meade, John Wambaugh, and Robert Pearce
References
Chen, L., Han, L., Saib, O. and Lian, G. (2015). In Silico Prediction of PercutaneousAbsorption and Disposition Kinetics of Chemicals. Pharmaceutical Research 32, 1779-93, 10.1007/s11095-014-1575-0
Kilford PJ, Gertz M, Houston JB, Galetin A (2008).“Hepatocellular binding of drugs: correction for unbound fraction in hepatocyte incubations using microsomal binding or drug lipophilicity data.”Drug Metabolism and Disposition,36(7), 1194–1197.doi:10.1124/dmd.108.020834.
Potts, R. O., Guy, R. H. (1992). Predicting skin permeability. Pharmaceutical research 9(5), 663-9, 10.1002/ajim.4700230505.
Sawyer, M. E., Evans, M. V., Wilson, C. A., Beesley, L. J., Leon, L. S., Eklund, C. R., Croom, E. L., Pegram, R. A. (2016). Development of a human physiologically based pharmacokinetic (PBPK) model for dermal permeability for lindane. ToxicologyLetters 245, 106-9, 10.1016/j.toxlet.2016.01.008
See Also
Examples
params <- parameterize_dermal_pbtk(chem.cas="80-05-7")params <- parameterize_dermal_pbtk(chem.cas="80-05-7", model.type="dermal_1subcomp", method.permeability="Potts-Guy")params <- parameterize_dermal_pbtk(chem.cas="80-05-7", model.type="dermal", Kvehicle2water = "octanol")Parameterize_fetal_PBTK
Description
This function initializes the parameters needed in the functionssolve_fetal_pbtk by calling parameterize_pbtk and adding additional parameters.
Usage
parameterize_fetal_pbtk( chem.cas = NULL, chem.name = NULL, dtxsid = NULL, species = "Human", fetal_fup_adjustment = TRUE, return.kapraun2019 = TRUE, suppress.messages = FALSE, ...)Arguments
chem.cas | Either the chemical name or the CAS number must bespecified. |
chem.name | Either the chemical name or the CAS number must bespecified. |
dtxsid | EPA's DSSTox Structure ID (https://comptox.epa.gov/dashboard)the chemical must be identified by either CAS, name, or DTXSIDs |
species | Included for compatibility with other functions, but the modelwill not run for non-human species (default "Human"). |
fetal_fup_adjustment | Logical indicator of whether to use an adjustedestimate for fetal fup based on the fetal:maternal plasma protein bindingratios presented in McNamara and Alcorn's 2002 study "Protein BindingPredictions in Infants." Defaults to TRUE. |
return.kapraun2019 | If TRUE (default) the empirical parameters for theKapraun et al. (2019) maternal-fetal growth parameters are provided. |
suppress.messages | Whether or not the output message is suppressed. |
... | Arguments passed to parameterize_pbtk. |
Details
Because this model does not simulate exhalation, inhalation, and other processes relevant to volatile chemicals, this model is by default restricted to chemicals with a logHenry's Law Constant less than that of Acetone, a known volatile chemical. That is, chemicals with logHLC > -4.5 (Log10 atm-m3/mole) are excluded. Volatility is not purely determined by the Henry's Law Constant, therefore this chemical exclusion may be turned off with the argument "physchem.exclude = FALSE". Similarly, per- and polyfluoroalkyl substances (PFAS) are excluded by default because the transporters that often drive PFAS toxicokinetics are not included in this model. However, PFAS chemicals can be included with the argument "class.exclude = FALSE".
Value
pre_pregnant_BW | Body Weight before pregnancy, kg. |
Clmetabolismc | Hepatic Clearance, L/h/kg BW. |
Fabsgut | Fraction of the oral dose absorbed, i.e. the fraction of the dose that enters the gutlumen. |
Funbound.plasma | Fraction of plasma that is not bound. |
Fhep.assay.correction | The fraction of chemical unbound in hepatocyteassay using the method of Kilford et al. (2008) |
hematocrit | Percent volume of red blood cells in the blood. |
Kadipose2pu | Ratio of concentration of chemical in adipose tissue to unbound concentration in plasma. |
Kgut2pu | Ratio of concentration of chemical in gut tissue to unbound concentration in plasma. |
kgutabs | Rate that chemical enters the gut from gutlumen, 1/h. |
Kkidney2pu | Ratio of concentration of chemical in kidney tissue tounbound concentration in plasma. |
Kliver2pu | Ratio of concentration ofchemical in liver tissue to unbound concentration in plasma. |
Klung2pu | Ratio of concentration of chemical in lung tissue to unboundconcentration in plasma. |
Krbc2pu | Ratio of concentration of chemicalin red blood cells to unbound concentration in plasma. |
Krest2pu | Ratio of concentration of chemical in rest of body tissue tounbound concentration in plasma. |
Kthyroid2pu | Ratio of concentration of chemical in thyroid tissue to unbound concentration in plasma. |
Kfgut2pu | Ratio of concentration of chemical in fetal gut tissue tounbound concentration in plasma. |
Kfkidney2pu | Ratio of concentrationof chemical in fetal kidney tissue to unbound concentration in plasma. |
Kfliver2pu | Ratio of concentration of chemical in fetal liver tissueto unbound concentration in plasma. |
Kflung2pu | Ratio of concentrationof chemical in fetal lung tissue to unbound concentration in plasma. |
Kfrest2pu | Ratio of concentration of chemical in fetal rest of bodytissue to unbound concentration in plasma. |
Kfbrain2pu | Ratio of concentration of chemical in fetal brain tissue to unbound concentration in plasma. |
Kfthyroid2pu | Ratio of concentration of chemical in fetal thyroidtissue to unbound concentration in plasma. |
Kplacenta2pu | Ratio of concentration of chemical in placental tissue to unbound concentration in maternal plasma. |
Kfplacenta2pu | Ratio of concentration of chemical inplacental tissue to unbound concentration in fetal plasma. |
million.cells.per.gliver | Millionscells per gram of liver tissue. |
MW | Molecular Weight, g/mol. |
pH_Plasma_mat | pH of the maternal plasma. |
Qgfr | Glomerular Filtration Rate, L/h/kg BW^3/4, volume of fluidfiltered from kidney and excreted. |
Rblood2plasma | The ratio of theconcentration of the chemical in the blood to the concentration in theplasma from available_rblood2plasma. |
Vgutc | Volume of the gut per kg bodyweight, L/kg BW. |
Vkidneyc | Volume of the kidneys per kg body weight, L/kgBW. |
Vliverc | Volume of the liver per kg body weight, L/kg BW. |
Vlungc | Volume of the lungs per kg body weight, L/kg BW. |
Vthyroidc | Volume of the thyroid per kg body weight, L/kg BW. |
Author(s)
Robert Pearce, Mark Sfeir, John Wambaugh, and Dustin Kapraun
Mark Sfeir, Dustin Kapraun, John Wambaugh
References
Kilford PJ, Gertz M, Houston JB, Galetin A (2008).“Hepatocellular binding of drugs: correction for unbound fraction in hepatocyte incubations using microsomal binding or drug lipophilicity data.”Drug Metabolism and Disposition,36(7), 1194–1197.doi:10.1124/dmd.108.020834.
McNamara PJ, Alcorn J (2002).“Protein binding predictions in infants.”Aaps Pharmsci,4, 19–26.doi:10.1208/ps040104.
Kapraun DF, Wambaugh JF, Setzer RW, Judson RS (2019).“Empirical models for anatomical and physiological changes in a human mother and fetus during pregnancy and gestation.”PLOS ONE,14(5), 1-56.doi:10.1371/journal.pone.0215906.
Kapraun DF, Sfeir M, Pearce RG, Davidson-Fritz SE, Lumen A, Dallmann A, Judson RS, Wambaugh JF (2022).“Evaluation of a rapid, generic human gestational dose model.”Reproductive Toxicology,113, 172–188.doi:10.1016/j.reprotox.2022.09.004.
See Also
Examples
parameters1 <- parameterize_fetal_pbtk(chem.cas='80-05-7') parameters2 <- parameterize_fetal_pbtk(chem.name='Bisphenol-A',species='Rat')# The following will not work because Diquat dibromide monohydrate's # Henry's Law Constant (-3.912) is higher than that of Acetone (~-4.5):try(parameters3 <- parameterize_fetal_pbtk(chem.cas = "6385-62-2"))# However, we can turn off checking for phys-chem properties, since we know# that Diquat dibromide monohydrate is not too volatile:parameters3 <- parameterize_fetal_pbtk(chem.cas = "6385-62-2", physchem.exclude = FALSE)Parameters for a generic gas inhalation physiologically-based toxicokinetic model
Description
This function initializes the parameters needed for the model 'gas_pbtk', forexamplesolve_gas_pbtk. Chemical- and species-specific model parameters are generated. These include tissue:plasma partition coefficients via Schmitt (2008)'s method as modified by Pearce et al. (2017). Organ volumes and flows are retrieved from tablephysiology.data). This modelwas first described by Linakis et al. (2020).
Usage
parameterize_gas_pbtk( chem.cas = NULL, chem.name = NULL, dtxsid = NULL, species = "Human", default.to.human = FALSE, tissuelist = list(liver = c("liver"), kidney = c("kidney"), lung = c("lung"), gut = c("gut")), force.human.clint.fup = FALSE, clint.pvalue.threshold = 0.05, adjusted.Funbound.plasma = TRUE, adjusted.Clint = TRUE, regression = TRUE, vmax = 0, km = 1, exercise = FALSE, fR = 12, VT = 0.75, VD = 0.15, suppress.messages = FALSE, minimum.Funbound.plasma = 1e-04, Caco2.options = list(), class.exclude = TRUE, physchem.exclude = TRUE, restrictive.clearance = FALSE, ...)Arguments
chem.cas | Either the chemical name or the CAS number must bespecified. |
chem.name | Either the chemical name or the CAS number must bespecified. |
dtxsid | EPA's DSSTox Structure ID (https://comptox.epa.gov/dashboard)the chemical must be identified by either CAS, name, or DTXSIDs |
species | Species desired (either "Rat", "Rabbit", "Dog", "Mouse", ordefault "Human"). |
default.to.human | Substitutes missing animal values with human valuesif true (hepatic intrinsic clearance or fraction of unbound plasma). |
tissuelist | Specifies compartment names and tissues groupings.Remaining tissues in tissue.data are lumped in the rest of the body.However, solve_pbtk only works with the default parameters. |
force.human.clint.fup | Forces use of human values for hepaticintrinsic clearance and fraction of unbound plasma if true. |
clint.pvalue.threshold | Hepatic clearance for chemicals where the invitro clearance assay result has a p-values greater than the threshold areset to zero. |
adjusted.Funbound.plasma | Uses Pearce et al. (2017) lipid binding adjustmentfor Funbound.plasma (which impacts partition coefficients) when set to TRUE (Default). |
adjusted.Clint | Uses Kilford et al. (2008) hepatocyte incubationbinding adjustment for Clint when set to TRUE (Default). |
regression | Whether or not to use the regressions in calculatingpartition coefficients. |
vmax | Michaelis-Menten vmax value in reactions/min |
km | Michaelis-Menten concentration of half-maximal reaction velocityin desired output concentration units. |
exercise | Logical indicator of whether to simulate an exercise-inducedheightened respiration rate |
fR | Respiratory frequency (breaths/minute), used especially to adjustbreathing rate in the case of exercise. This parameter, along with VT and VD(below) gives another option for calculating Qalv (Alveolar ventilation) in case pulmonary ventilation rate is not known |
VT | Tidal volume (L), to be modulated especially as part of simulatingthe state of exercise |
VD | Anatomical dead space (L), to be modulated especially as part ofsimulating the state of exercise |
suppress.messages | Whether or not the output messages are suppressed. |
minimum.Funbound.plasma | Monte Carlo draws less than this value are set equal to this value (default is 0.0001 – half the lowest measured Fup in ourdataset). |
Caco2.options | A list of options to use when working with Caco2 apical to basolateral data |
class.exclude | Exclude chemical classes identified as outside of domain of applicability by relevant modelinfo_[MODEL] file (default TRUE). |
physchem.exclude | Exclude chemicals on the basis of physico-chemicalproperties (currently only Henry's law constant) as specified by the relevant modelinfo_[MODEL] file (default TRUE). |
restrictive.clearance | Protein binding not taken into account (set to1) in liver clearance if FALSE. (Default is FALSE.) |
... | Other parameters |
Details
Per- and polyfluoroalkyl substances (PFAS) are excluded by default because the transporters that often drive PFAS toxicokinetics are not included in this model. However, PFAS chemicals can be included with the argument "class.exclude = FALSE".
Value
BW | Body Weight, kg. |
Clint | Hepatic intrinsic clearance, uL/min/10^6 cells |
Clint.dist | Distribution of hepatic intrinsic clearance values(median, lower 95th, upper 95th, p value) |
Clmetabolismc | Hepatic Clearance, L/h/kg BW. |
Fabsgut | Fraction of the oral dose absorbed, i.e. the fraction of thedose that enters the gut lumen. |
Fhep.assay.correction | The fraction of chemical unbound in hepatocyteassay using the method of Kilford et al. (2008) |
Funbound.plasma | Fraction of chemical unbound to plasma. |
Funbound.plasma.adjustment | Fraction unbound to plasma adjusted asdescribed in Pearce et al. 2017 |
Funbound.plasma.dist | Distribution of fraction unbound to plasma(median, lower 95th, upper 95th) |
hematocrit | Percent volume of red blood cells in the blood. |
Kblood2air | Ratio of concentration of chemical in blood to air |
Kgut2pu | Ratio of concentration of chemical in gut tissue to unboundconcentration in plasma. |
kgutabs | Rate that chemical enters the gut from gutlumen, 1/h. |
Kkidney2pu | Ratio of concentration of chemical in kidney tissue tounbound concentration in plasma. |
Kliver2pu | Ratio of concentration of chemical in liver tissue tounbound concentration in plasma. |
Klung2pu | Ratio of concentration of chemical in lung tissueto unbound concentration in plasma. |
km | Michaelis-Menten concentration of half-maximal activity |
Kmuc2air | Mucus to air partition coefficient |
Krbc2pu | Ratio of concentration of chemical in red blood cells tounbound concentration in plasma. |
Krest2pu | Ratio of concentration of chemical in rest of body tissue tounbound concentration in plasma. |
kUrtc | Unscaled upper respiratory tract uptake parameter (L/h/kg^0.75) |
liver.density | Density of liver in g/mL |
MA | phospholipid:water distribution coefficient, membrane affinity |
million.cells.per.gliver | Millions cells per gram of liver tissue. |
MW | Molecular Weight, g/mol. |
pKa_Accept | compound H association equilibrium constant(s) |
pKa_Donor | compound H dissociation equilibirum constant(s) |
Pow | octanol:water partition coefficient (not log transformed) |
Qalvc | Unscaled alveolar ventilation rate (L/h/kg^0.75) |
Qcardiacc | Cardiac Output, L/h/kg BW^3/4. |
Qgfrc | Glomerular Filtration Rate, L/h/kg BW^0.75, volume of fluidfiltered from kidney and excreted. |
Qgutf | Fraction of cardiac output flowing to the gut. |
Qkidneyf | Fraction of cardiac output flowing to the kidneys. |
Qliverf | Fraction of cardiac output flowing to the liver. |
Qlungf | Fraction of cardiac output flowing to lung tissue. |
Qrestf | Fraction of blood flow to rest of body |
Rblood2plasma | The ratio of the concentration of the chemical in theblood to the concentration in the plasma from available_rblood2plasma. |
Vartc | Volume of the arteries per kg body weight, L/kg BW. |
Vgutc | Volume of the gut per kg body weight, L/kg BW. |
Vkidneyc | Volume of the kidneys per kg body weight, L/kg BW. |
Vliverc | Volume of the liver per kg body weight, L/kg BW. |
Vlungc | Volume of the lungs per kg body weight, L/kg BW. |
vmax | Michaelis-Menten maximum reaction velocity (1/min) |
Vmucc | Unscaled mucosal volume (L/kg BW^0.75 |
Vrestc | Volume of the rest of the body per kg body weight, L/kg BW. |
Vvenc | Volume of the veins per kg body weight, L/kg BW. |
Author(s)
Matt Linakis, Robert Pearce, John Wambaugh
References
Linakis MW, Sayre RR, Pearce RG, Sfeir MA, Sipes NS, Pangburn HA, Gearhart JM, Wambaugh JF (2020).“Development and evaluation of a high-throughput inhalation model for organic chemicals.”Journal of exposure science & environmental epidemiology,30(5), 866–877.doi:10.1038/s41370-020-0238-y.
Schmitt W (2008).“General approach for the calculation of tissue to plasma partition coefficients.”Toxicology in vitro,22(2), 457–467.doi:10.1016/j.tiv.2007.09.010.
Pearce RG, Setzer RW, Davis JL, Wambaugh JF (2017).“Evaluation and calibration of high-throughput predictions of chemical distribution to tissues.”Journal of pharmacokinetics and pharmacodynamics,44, 549–565.doi:10.1007/s10928-017-9548-7.
Kilford PJ, Gertz M, Houston JB, Galetin A (2008).“Hepatocellular binding of drugs: correction for unbound fraction in hepatocyte incubations using microsomal binding or drug lipophilicity data.”Drug Metabolism and Disposition,36(7), 1194–1197.doi:10.1124/dmd.108.020834.
See Also
Examples
parameters <- parameterize_gas_pbtk(chem.cas='129-00-0')parameters <- parameterize_gas_pbtk(chem.name='pyrene',species='Rat')parameterize_gas_pbtk(chem.cas = '56-23-5')parameters <- parameterize_gas_pbtk(chem.name='Carbon tetrachloride',species='Rat')# Change the tissue lumping:compartments <- list(liver=c("liver"),fast=c("heart","brain","muscle","kidney"), lung=c("lung"),gut=c("gut"),slow=c("bone"))parameterize_gas_pbtk(chem.name="Bisphenol a",species="Rat",default.to.human=TRUE, tissuelist=compartments)Parameterize Kramer IVD Model
Description
This function takes inputs from kramer_eval() and calls parameterize_IVD(). Converts units and sets up variables for kramer_eval().
Usage
parameterize_kramer( tcdata = NA, casrn.vector = NA_character_, this.FBSf = NA_real_, this.BSA = 44, this.v_total = NA_real_, this.v_working = NA_real_, this.cell_yield = NA_real_, this.sarea = NA_real_, this.prot_conc = 0.21)Arguments
tcdata | A data table with well_number corresponding to plate format,optionally include v_working, sarea, option.bottom, and option.plastic |
casrn.vector | A deprecated argument specifying a single or vector of Chemical Abstracts Service Registry Number(s) (CAS-RN) of desired chemical(s). |
this.FBSf | Fraction fetal bovine serum |
this.BSA | bovine serum albumin concentration (g/L) |
this.v_total | Total volume per well (uL) |
this.v_working | Working volume per well (uL) |
this.cell_yield | Number of cells/well seeded |
this.sarea | Surface area per well (m^2) |
this.prot_conc | Cell protein concentration (mg protein/million cells) |
Value
A data table composed of any input data.tabletcdatawith only the following columns either created or altered by this function:
| Column Name | Description | Units |
| sarea | surface area | m^2 |
| v_working_m3 | working (filled) volume of each well | m^3 |
| v_total_m3 | total volume of each well | m^3 |
| v_headspace_m3 | volume of headspace per well | m^3 |
| conc_BSA | BSA concentration in media | kg/L |
| FBSp | Percent fetal bovine serum in media | percent |
| conc_cell_mg | concentration of cell lipids | mg/m^3 |
| conc_cell | concentration of cell lipids | kg/m^3 |
| conc_plastic | concentration of plastic | m2/m^3 |
Author(s)
Meredith Scherer
References
Kramer NI, others (2010).Measuring, modeling, and increasing the free concentration of test chemicals in cell assays.Utrecht University.
Parameters for a generic physiologically-based toxicokinetic model
Description
Generate a chemical- and species-specific set of PBPK model parameters.Parameters include tissue:plasma partition coefficients, organ volumes, and flows for the tissue lumping scheme specified by argument tissuelist.Tissure:(fraction unbound in) plasma partitition coefficients are predictedvia Schmitt (2008)'s method as modified by Pearce et al. (2017) usingpredict_partitioning_schmitt. Organ volumes and flows areretrieved from tablephysiology.data.Tissues must be described in tabletissue.data.
Usage
parameterize_pbtk( chem.cas = NULL, chem.name = NULL, dtxsid = NULL, species = "Human", default.to.human = FALSE, tissuelist = list(liver = c("liver"), kidney = c("kidney"), lung = c("lung"), gut = c("gut")), force.human.clint.fup = FALSE, clint.pvalue.threshold = 0.05, adjusted.Funbound.plasma = TRUE, adjusted.Clint = TRUE, regression = TRUE, suppress.messages = FALSE, restrictive.clearance = TRUE, minimum.Funbound.plasma = 1e-04, class.exclude = TRUE, physchem.exclude = TRUE, million.cells.per.gliver = 110, liver.density = 1.05, kgutabs = NA, Caco2.options = NULL, ...)Arguments
chem.cas | Chemical Abstract Services Registry Number (CAS-RN) – the chemical must be identified by either CAS, name, or DTXISD |
chem.name | Chemical name (spaces and capitalization ignored) – the chemical must be identified by either CAS, name, or DTXISD |
dtxsid | EPA's 'DSSTox Structure ID (https://comptox.epa.gov/dashboard)– the chemical must be identified by either CAS, name, or DTXSIDs |
species | Species desired (either "Rat", "Rabbit", "Dog", "Mouse", ordefault "Human"). |
default.to.human | Substitutes missing animal values with human valuesif true (hepatic intrinsic clearance or fraction of unbound plasma). |
tissuelist | Specifies compartment names and tissues groupings.Remaining tissues in tissue.data are lumped in the rest of the body.However, |
force.human.clint.fup | Forces use of human values for hepaticintrinsic clearance and fraction of unbound plasma if true. |
clint.pvalue.threshold | Hepatic clearance for chemicals where the invitro clearance assay result has a p-values greater than the threshold areset to zero. |
adjusted.Funbound.plasma | Uses Pearce et al. (2017) lipid binding adjustmentfor Funbound.plasma (which impacts partition coefficients) when set to TRUE (Default). |
adjusted.Clint | Uses Kilford et al. (2008) hepatocyte incubationbinding adjustment for Clint when set to TRUE (Default). |
regression | Whether or not to use the regressions in calculatingpartition coefficients. |
suppress.messages | Whether or not the output message is suppressed. |
restrictive.clearance | In calculating hepatic.bioavailability, proteinbinding is not taken into account (set to 1) in liver clearance if FALSE. |
minimum.Funbound.plasma |
|
class.exclude | Exclude chemical classes identified as outside of domain of applicability by relevant modelinfo_[MODEL] file (default TRUE). |
physchem.exclude | Exclude chemicals on the basis of physico-chemicalproperties (currently only Henry's law constant) as specified by the relevant modelinfo_[MODEL] file (default TRUE). |
million.cells.per.gliver | Hepatocellularity (defaults to 110 10^6 cells/g-liver, from Carlile et al. (1997)) |
liver.density | Liver density (defaults to 1.05 g/mL from International Commission on Radiological Protection (1975)) |
kgutabs | Oral absorption rate from gut (determined from Peff) |
Caco2.options | A list of options to use when working with Caco2 apical to basolateral data |
... | Additional arguments, not currently used. |
Details
By default, this function initializes the parameters needed in the functionssolve_pbtk,calc_css, and others using the httk default generic PBTK model (for oral and intravenous dosing only).
The default PBTK model includes an explicit first pass of the chemical throughthe liver before it becomes available to systemic blood. We model systemic oral bioavailability as Fbio=Fabs*Fgut*Fhep.Only if Fbiohas been measured in vivo and is found intablechem.physical_and_invitro.data then we set Fabs*Fgut to the measured value divided by Fhep where Fhepis estimated from in vitro TK data usingcalc_hep_bioavailability.If Caco2 membrane permeability data or predictionsare available Fabs is estimatedusingcalc_fabs.oral.Intrinsic hepatic metabolism is used to very roughly estimateFgutusingcalc_fgut.oral.
Because this model does not simulate exhalation, inhalation, and other processes relevant to volatile chemicals, this model is by default restricted to chemicals with a logHenry's Law Constant less than that of Acetone, a known volatile chemical. That is, chemicals with logHLC > -4.5 (Log10 atm-m3/mole) are excluded. Volatility is not purely determined by the Henry's Law Constant, therefore this chemical exclusion may be turned off with the argument "physchem.exclude = FALSE". Similarly, per- and polyfluoroalkyl substances (PFAS) are excluded by default because the transporters that often drive PFAS toxicokinetics are not included in this model. However, PFAS chemicals can be included with the argument "class.exclude = FALSE".
Value
BW | Body Weight, kg. |
Clmetabolismc | Hepatic Clearance, L/h/kg BW. |
Fabsgut | Fraction of the oral dose absorbed, i.e. the fraction ofthe dose that enters the gutlumen. |
Funbound.plasma | Fraction of plasma that is not bound. |
Fhep.assay.correction | The fraction of chemical unbound in hepatocyteassay using the method of Kilford et al. (2008) |
hematocrit | Percent volume of red blood cells in the blood. |
Kgut2pu | Ratio of concentration of chemical in gut tissue to unboundconcentration in plasma. |
kgutabs | Rate that chemical enters the gut from gutlumen, 1/h. |
Kkidney2pu | Ratio of concentration of chemical in kidney tissue tounbound concentration in plasma. |
Kliver2pu | Ratio of concentration of chemical in liver tissue tounbound concentration in plasma. |
Klung2pu | Ratio of concentration of chemical in lung tissueto unbound concentration in plasma. |
Krbc2pu | Ratio of concentration of chemical in red blood cells tounbound concentration in plasma. |
Krest2pu | Ratio of concentration of chemical in rest of body tissue tounbound concentration in plasma. |
million.cells.per.gliver | Millions cells per gram of liver tissue. |
MW | Molecular Weight, g/mol. |
Qcardiacc | Cardiac Output, L/h/kg BW^3/4. |
Qgfrc | Glomerular Filtration Rate, L/h/kg BW^3/4, volume of fluidfiltered from kidney and excreted. |
Qgutf | Fraction of cardiac output flowing to the gut. |
Qkidneyf | Fraction of cardiac output flowing to the kidneys. |
Qliverf | Fraction of cardiac output flowing to the liver. |
Rblood2plasma | The ratio of the concentration of the chemical in theblood to the concentration in the plasma from available_rblood2plasma. |
Vartc | Volume of the arteries per kg body weight, L/kg BW. |
Vgutc | Volume of the gut per kg body weight, L/kg BW. |
Vkidneyc | Volume of the kidneys per kg body weight, L/kg BW. |
Vliverc | Volume of the liver per kg body weight, L/kg BW. |
Vlungc | Volume of the lungs per kg body weight, L/kg BW. |
Vrestc | Volume of the rest of the body per kg body weight, L/kg BW. |
Vvenc | Volume of the veins per kg body weight, L/kg BW. |
Author(s)
John Wambaugh and Robert Pearce
References
Pearce RG, Setzer RW, Strope CL, Wambaugh JF, Sipes NS (2017).“Httk: R package for high-throughput toxicokinetics.”Journal of Statistical Software,79(4), 1.doi:10.18637/jss.v079.i04.
Schmitt W (2008).“General approach for the calculation of tissue to plasma partition coefficients.”Toxicology in vitro,22(2), 457–467.doi:10.1016/j.tiv.2007.09.010.
Pearce RG, Setzer RW, Davis JL, Wambaugh JF (2017).“Evaluation and calibration of high-throughput predictions of chemical distribution to tissues.”Journal of pharmacokinetics and pharmacodynamics,44, 549–565.doi:10.1007/s10928-017-9548-7.
Kilford PJ, Gertz M, Houston JB, Galetin A (2008).“Hepatocellular binding of drugs: correction for unbound fraction in hepatocyte incubations using microsomal binding or drug lipophilicity data.”Drug Metabolism and Disposition,36(7), 1194–1197.doi:10.1124/dmd.108.020834.
International Commission on Radiological Protection. Report of the task group on reference man. Vol. 23. Pergamon, Oxford. 1975.
See Also
Examples
parameters1 <- parameterize_pbtk(chem.cas='80-05-7') parameters2 <- parameterize_pbtk(chem.name='Bisphenol-A',species='Rat') # Change the tissue lumping (note, these model parameters will not work with our current solver): compartments <- list(liver=c("liver"),fast=c("heart","brain","muscle","kidney"), lung=c("lung"),gut=c("gut"),slow=c("bone")) parameterize_pbtk(chem.name="Bisphenol a",species="Rat",default.to.human=TRUE, tissuelist=compartments)# The following will not work because Diquat dibromide monohydrate's # Henry's Law Constant (-3.912) is higher than that of Acetone (~-4.5):try(parameters3 <- parameterize_pbtk(chem.cas = "6385-62-2"))# However, we can turn off checking for phys-chem properties, since we know# that Diquat dibromide monohydrate is not too volatile:parameters3 <- parameterize_pbtk(chem.cas = "6385-62-2", physchem.exclude = FALSE)Parameters for a one compartment (empirical) toxicokinetic model for PFAS
Description
This function initializes the parameters needed in the function solve_1comp.The toxicokinetic model is of the form of anempirical, single compartment in which all tissues are well mixed. The route of exposure can be oral or intravenous. For oral exposures a hepatic extraction factor (first-pass metabolism) is estimated usingchemical-specificin vitro-measured intrinsic hepatic clearance and fractionunbound in plasma, if available. If these chemical-specific parameters are not available then all chemical is assumed to be absorbed. The rate of oral absorption usedis 2.2 L/h, the median rate observed across 44 chemicals by Wambaugh et al. (2018) (doi:10.1093/toxsci/kfy020).There is a single, unspecified route of elimination (clearance). Half-life is estimated using the Dawson et al. (2023) (doi:10.3390/toxics11020098) machine learning model for per- and poly-fluorinated alkyl substances (PFAS).In keeping with the findings of that paper, volume of distribution is held fixed at 0.205 L kg/BW. Clearance is calculated as the product of eliminationrate (determined from half-life) and the volume of distribution.The ratio of chemical concentration in blood to plasma is determinedaccording toPoothong et al. (2017) (doi:10.1021/acs.est.7b03299)where compounds that are ionized at pH 7.4 (plasma) get a value of 0.5, whilechemicals that are neutral get a value of 20.
Usage
parameterize_pfas1comp( chem.cas = NULL, chem.name = NULL, dtxsid = NULL, species = "Human", sex = "Female", dosingadj = "Oral", restrict.doa = "ClassModDomain", estimate.firstpass = TRUE, suppress.messages = FALSE, Caco2.options = list(), class.exclude = TRUE, physchem.exclude = TRUE)Arguments
chem.cas | Chemical Abstract Services Registry Number (CAS-RN) – the chemical must be identified by either CAS, name, or DTXISD |
chem.name | Chemical name (spaces and capitalization ignored) – the chemical must be identified by either CAS, name, or DTXISD |
dtxsid | EPA's DSSTox Structure ID (https://comptox.epa.gov/dashboard)– the chemical must be identified by either CAS, name, or DTXSIDs |
species | Species desired (either "Rat", "Rabbit", "Dog", "Mouse", ordefault "Human"). |
sex | Sex of simulated individual ("Male" or "Female") |
dosingadj | Route of dosing for Dawson et al. (2023) PFAS half-life model("oral", "iv", or "other") |
restrict.doa | Whether to restrict to chemicals within an estimateddomain of applicability based on the properties of the training set("ClassModDomain"), the domain of all models ("AMAD"), or none ("none")(Defaults to "ClassModDomain"). |
estimate.firstpass | Whether to estimate first-pass hepatic metabolism,which can only be done for a subset of PFAS with in vitro HTTK parameters(Defaults to TRUE). |
suppress.messages | Whether to suppress messages (Defaults to FALSE). |
Caco2.options | A list of options to use when working with Caco2 apical to basolateral data |
class.exclude | Exclude chemical classes identified as outside of domain of applicability by relevant modelinfo_[MODEL] file (default TRUE). |
physchem.exclude | Exclude chemicals on the basis of physico-chemicalproperties (currently only Henry's law constant) as specified by the relevant modelinfo_[MODEL] file (default TRUE). |
Value
Vdist | Volume of distribution, units of L/kg BW. |
plasma.vol | Volume of the plasma, L/kg BW. |
Fabsgut | Fraction of the oral dose absorbed, that is, the fraction of thedose that enters the gutlumen. |
Fhep.assay.correction | Not used for this model |
kelim | Elimination rate, units of 1/h. |
hematocrit | Percent volume of red blood cells in the blood. |
kgutabs | Rate chemical is absorbed, 1/h. |
million.cells.per.gliver | Not used for this model |
MW | Molecular Weight, g/mol. |
Rblood2plasma | The ratio of the concentration of the chemical in the blood to the concentration in the plasma. Not used in calculations but included for the conversion of plasma outputs. |
hepatic.bioavailability | Fraction of dose remaining afterfirst pass clearance, calculated from the corrected well-stirred model. |
BW | Body Weight, kg. |
pKa_Donor | Ionization equilibria (if any) for hydrogen donation (acids). |
pKa_Accept | Ionization equilibria (if any) for hydrogen acceptance (bases). |
Author(s)
John Wambaugh
References
Dawson DE, Lau C, Pradeep P, Sayre RR, Judson RS, Tornero-Velez R, Wambaugh JF (2023).“A machine learning model to estimate toxicokinetic half-lives of per-and polyfluoro-alkyl substances (PFAS) in multiple species.”Toxics,11(2), 98.
Pearce RG, Setzer RW, Strope CL, Wambaugh JF, Sipes NS (2017).“Httk: R package for high-throughput toxicokinetics.”Journal of Statistical Software,79(4), 1.doi:10.18637/jss.v079.i04.
Schmitt W (2008).“General approach for the calculation of tissue to plasma partition coefficients.”Toxicology in vitro,22(2), 457–467.doi:10.1016/j.tiv.2007.09.010.
Pearce RG, Setzer RW, Davis JL, Wambaugh JF (2017).“Evaluation and calibration of high-throughput predictions of chemical distribution to tissues.”Journal of pharmacokinetics and pharmacodynamics,44, 549–565.doi:10.1007/s10928-017-9548-7.
Wambaugh JF, Hughes MF, Ring CL, MacMillan DK, Ford J, Fennell TR, Black SR, Snyder RW, Sipes NS, Wetmore BA, others (2018).“Evaluating in vitro-in vivo extrapolation of toxicokinetics.”Toxicological Sciences,163(1), 152–169.doi:10.1093/toxsci/kfy020.
Poothong S, Thomsen C, Padilla-Sanchez JA, Papadopoulou E, Haug LS (2017).“Distribution of novel and well-known poly-and perfluoroalkyl substances (PFASs) in human serum, plasma, and whole blood.”Environmental science & technology,51(22), 13388–13396.
See Also
Examples
# Human elimination rate for PFOA:parameterize_pfas1comp(dtxsid="DTXSID8031865")$kelim# Female rat is much faster than human:parameterize_pfas1comp(dtxsid="DTXSID8031865", species="rat")$kelim# Male rat is slower than female but faster than humans:parameterize_pfas1comp(dtxsid="DTXSID8031865", species="rat", sex="male")$kelimParameters for Schmitt's (2008) Tissue Partition Coefficient Method
Description
This function provides the necessary parameters to runpredict_partitioning_schmitt, excluding the data in tabletissue.data. The model is based on the Schmitt (2008) (doi:10.1016/j.tiv.2007.09.010)method for predicting tissue:plasma partition coefficients as modified by Pearce et al. (2017) (doi:10.1007/s10928-017-9548-7). The modifications include approaches adapted from Peyret et al. (2010) (doi:10.1016/j.taap.2010.09.010).
Usage
parameterize_schmitt( chem.cas = NULL, chem.name = NULL, dtxsid = NULL, parameters = NULL, species = "Human", default.to.human = FALSE, force.human.fup = FALSE, adjusted.Funbound.plasma = TRUE, suppress.messages = FALSE, class.exclude = TRUE, minimum.Funbound.plasma = 1e-04, pfas.calibration = TRUE)Arguments
chem.cas | Chemical Abstract Services Registry Number (CAS-RN) – ifparameters is not specified then the chemical must be identified by eitherCAS, name, or DTXISD |
chem.name | Chemical name (spaces and capitalization ignored) – ifparameters is not specified then the chemical must be identified by eitherCAS, name, or DTXISD |
dtxsid | EPA's DSSTox Structure ID (https://comptox.epa.gov/dashboard)– if parameters is not specified then the chemical must be identified by either CAS, name, or DTXSIDs |
parameters | Chemcial and physiological description parameters neededto run the Schmitt et al. (2008) model |
species | Species desired (either "Rat", "Rabbit", "Dog", "Mouse", ordefault "Human"). |
default.to.human | Substitutes missing fraction of unbound plasma withhuman values if true. |
force.human.fup | Returns human fraction of unbound plasma incalculation for rats if true.When species is specified as rabbit, dog, or mouse, the human unboundfraction is substituted. |
adjusted.Funbound.plasma | Uses Pearce et al. (2017) lipid binding adjustmentfor Funbound.plasma (which impacts partition coefficients) when set to TRUE (Default). |
suppress.messages | Whether or not the output message is suppressed. |
class.exclude | Exclude chemical classes identified as outside of domain of applicability by relevant modelinfo_[MODEL] file (default TRUE). |
minimum.Funbound.plasma | Monte Carlo draws less than this value are set equal to this value (default is 0.0001 – half the lowest measured Fup in ourdataset). |
pfas.calibration | Whether MA for chemicals in class PFAS should beincreased using the regression to the Droge (2019) dataset. |
Value
Funbound.plasma | Unbound fraction in plasma, adjusted for lipid binding according to Pearce et al. (2017) |
unadjusted.Funbound.plasma | measured unbound fraction in plasma (0.005if below limit of detection) |
Pow | octanol:water partition coefficient(not log transformed) |
pKa_Donor | compound H dissociation equilibriumconstant(s) |
pKa_Accept | compound H association equilibriumconstant(s) |
MA | phospholipid:water distribution coefficient, membraneaffinity |
Fprotein.plasma | protein fraction in plasma |
plasma.pH | pH of the plasma |
Author(s)
Robert Pearce and John Wambaugh
References
Pearce RG, Setzer RW, Strope CL, Wambaugh JF, Sipes NS (2017).“Httk: R package for high-throughput toxicokinetics.”Journal of Statistical Software,79(4), 1.doi:10.18637/jss.v079.i04.
Schmitt W (2008).“General approach for the calculation of tissue to plasma partition coefficients.”Toxicology in vitro,22(2), 457–467.doi:10.1016/j.tiv.2007.09.010.
Schmitt W (2008).“Corrigendum to:'General approach for the calculation of tissue to plasma partition coefficients'[Toxicology in Vitro 22 (2008) 457–467].”Toxicology in Vitro,22(6), 1666.doi:10.1016/j.tiv.2008.04.020.
Pearce RG, Setzer RW, Davis JL, Wambaugh JF (2017).“Evaluation and calibration of high-throughput predictions of chemical distribution to tissues.”Journal of pharmacokinetics and pharmacodynamics,44, 549–565.doi:10.1007/s10928-017-9548-7.
Peyret T, Poulin P, Krishnan K (2010).“A unified algorithm for predicting partition coefficients for PBPK modeling of drugs and environmental chemicals.”Toxicology and applied pharmacology,249(3), 197–207.doi:10.1016/j.taap.2010.09.010.
See Also
Examples
library(httk)# Create a list of parameters (that you can potentially change):p <- parameterize_schmitt(chem.name="bisphenola")# Predict the partition coefficients using a list of parameters:PCs <- predict_partitioning_schmitt(parameters = p)# Lump the tissues into the compartments for model "pbtk":lump_tissues(PCs)# Lump the tissues into a single volume of distributioncalc_vdist(parameters=c(p, PCs))Parameters for a three-compartment toxicokinetic model at steady-state
Description
This function initializes the parameters needed in the functionscalc_mc_css,calc_mc_oral_equiv, andcalc_analytic_css for the threecompartment steady state model ('3compartmentss') as used in Rotroff et al. (2010), Wetmore et al. (2012), Wetmore et al. (2015), and elsewhere. By assuming that enough time has passed to reach steady-state, weeliminate the need for tissue-specific parititon coefficients because we assume all tissues have come to equilibrium with the unbound concentrationin plasma. However, we still use chemical properties to predict the blood:plasma ratio for estimating first-pass hepatic metabolism for oralexposures.
Usage
parameterize_steadystate( chem.cas = NULL, chem.name = NULL, dtxsid = NULL, species = "Human", clint.pvalue.threshold = 0.05, default.to.human = FALSE, class.exclude = TRUE, physchem.exclude = TRUE, force.human.clint.fup = FALSE, adjusted.Funbound.plasma = TRUE, adjusted.Clint = TRUE, restrictive.clearance = TRUE, fup.lod.default = 0.005, suppress.messages = FALSE, minimum.Funbound.plasma = 1e-04, Caco2.options = NULL, ...)Arguments
chem.cas | Chemical Abstract Services Registry Number (CAS-RN) – the chemical must be identified by either CAS, name, or DTXISD |
chem.name | Chemical name (spaces and capitalization ignored) – the chemical must be identified by either CAS, name, or DTXISD |
dtxsid | EPA's DSSTox Structure ID (https://comptox.epa.gov/dashboard)– the chemical must be identified by either CAS, name, or DTXSIDs |
species | Species desired (either "Rat", "Rabbit", "Dog", "Mouse", ordefault "Human"). |
clint.pvalue.threshold | Hepatic clearances with clearance assayshaving p-values greater than the threshold are set to zero. |
default.to.human | Substitutes missing species-specific values with human values ifTRUE (default is FALSE). |
class.exclude | Exclude chemical classes identified as outside of domain of applicability by relevant modelinfo_[MODEL] file (default TRUE). |
physchem.exclude | Exclude chemicals on the basis of physico-chemicalproperties (currently only Henry's law constant) as specified by the relevant modelinfo_[MODEL] file (default TRUE). |
force.human.clint.fup | Uses human hepatic intrinsic clearance and fractionof unbound plasma in calculation of partition coefficients for rats if true. |
adjusted.Funbound.plasma | Uses Pearce et al. (2017) lipid binding adjustmentfor Funbound.plasma (which impacts partition coefficients) when set to TRUE (Default). |
adjusted.Clint | Uses Kilford et al. (2008) hepatocyte incubationbinding adjustment for Clint when set to TRUE (Default). |
restrictive.clearance | In calculating hepatic.bioavailability, proteinbinding is not taken into account (set to 1) in liver clearance if FALSE. |
fup.lod.default | Default value used for fraction of unbound plasma forchemicals where measured value was below the limit of detection. Defaultvalue is 0.0005. |
suppress.messages | Whether or not the output message is suppressed. |
minimum.Funbound.plasma | Monte Carlo draws less than this value are set equal to this value (default is 0.0001 – half the lowest measured Fup in ourdataset). |
Caco2.options | A list of options to use when working with Caco2 apical to basolateral data |
... | Other parameters |
Details
We model systemic oral bioavailability as Fbio=Fabs*Fgut*Fhep.Fhepis estimated from in vitro TK data usingcalc_hep_bioavailability.If Fbiohas been measured in vivo and is found intablechem.physical_and_invitro.data then we set Fabs*Fgut to the measured value divided by Fhep Otherwise, if Caco2 membrane permeability data or predictionsare available Fabs is estimatedusingcalc_fabs.oral.Intrinsic hepatic metabolism is used to very roughly estimateFgutusingcalc_fgut.oral.
Because this model does not simulate exhalation, inhalation, and other processes relevant to volatile chemicals, this model is by default restricted to chemicals with a logHenry's Law Constant less than that of Acetone, a known volatile chemical. That is, chemicals with logHLC > -4.5 (Log10 atm-m3/mole) are excluded. Volatility is not purely determined by the Henry's Law Constant, therefore this chemical exclusion may be turned off with the argument "physchem.exclude = FALSE". Similarly, per- and polyfluoroalkyl substances (PFAS) are excluded by default because the transporters that often drive PFAS toxicokinetics are not included in this model. However, PFAS chemicals can be included with the argument "class.exclude = FALSE".
Value
Clint | Hepatic Intrinsic Clearance, uL/min/10^6 cells. |
Fabsgut | Fraction of the oral dose absorbed and surviving gut metabolism, that is, the fraction of the dose that enters the gutlumen. |
Funbound.plasma | Fraction of plasma that is not bound. |
Qtotal.liverc | Flow rate of blood exiting the liver, L/h/kg BW^3/4. |
Qgfrc | Glomerular Filtration Rate, L/h/kgBW^3/4, volume of fluid filtered from kidney and excreted. |
BW | Body Weight, kg |
MW | Molecular Weight, g/mol |
million.cells.per.gliver | Millions cells per gram of liver tissue. |
Vliverc | Volume of the liver per kg body weight, L/kg BW. |
liver.density | Liver tissue density, kg/L. |
Fhep.assay.correction | The fraction of chemical unbound in hepatocyteassay using the method of Kilford et al. (2008) |
hepatic.bioavailability | Fraction of dose remaining after first passclearance, calculated from the corrected well-stirred model. |
Author(s)
John Wambaugh and Greg Honda
References
Pearce RG, Setzer RW, Strope CL, Wambaugh JF, Sipes NS (2017).“Httk: R package for high-throughput toxicokinetics.”Journal of Statistical Software,79(4), 1.doi:10.18637/jss.v079.i04.
Kilford PJ, Gertz M, Houston JB, Galetin A (2008).“Hepatocellular binding of drugs: correction for unbound fraction in hepatocyte incubations using microsomal binding or drug lipophilicity data.”Drug Metabolism and Disposition,36(7), 1194–1197.doi:10.1124/dmd.108.020834.
Wambaugh JF, Schacht CM, Ring CL (2025).“A Simple Physiologically Based Toxicokinetic Model for Multi-Route In Vitro–In Vivo Extrapolation.”Environmental Science & Technology Letters,12(3), 261–268.doi:10.1021/acs.estlett.4c00967.
Rotroff DM, Wetmore BA, Dix DJ, Ferguson SS, Clewell HJ, Houck KA, LeCluyse EL, Andersen ME, Judson RS, Smith CM, others (2010).“Incorporating human dosimetry and exposure into high-throughput in vitro toxicity screening.”Toxicological Sciences,117(2), 348–358.doi:10.1093/toxsci/kfq220.
Wetmore BA, Wambaugh JF, Ferguson SS, Sochaski MA, Rotroff DM, Freeman K, Clewell III HJ, Dix DJ, Andersen ME, Houck KA, others (2012).“Integration of dosimetry, exposure, and high-throughput screening data in chemical toxicity assessment.”Toxicological Sciences,125(1), 157–174.doi:10.1093/toxsci/kfr254.
Wetmore BA, Wambaugh JF, Allen B, Ferguson SS, Sochaski MA, Setzer RW, Houck KA, Strope CL, Cantwell K, Judson RS, others (2015).“Incorporating high-throughput exposure predictions with dosimetry-adjusted in vitro bioactivity to inform chemical toxicity testing.”Toxicological Sciences,148(1), 121–136.doi:10.1093/toxsci/kfv171.
See Also
Examples
parameters1 <- parameterize_steadystate(chem.name='Bisphenol-A',species='Rat') parameters2 <- parameterize_steadystate(chem.cas='80-05-7')# The following will not work because Diquat dibromide monohydrate's # Henry's Law Constant (-3.912) is higher than that of Acetone (~-4.5):try(parameters3 <- parameterize_steadystate(chem.cas = "6385-62-2"))# However, we can turn off checking for phys-chem properties, since we know# that Diquat dibromide monohydrate is not too volatile:parameters3 <- parameterize_steadystate(chem.cas = "6385-62-2", physchem.exclude = FALSE)Parameters for a three-compartment model at steady-state with exhalation
Description
This function initializes the parameters needed in the functionscalc_mc_css,calc_mc_oral_equiv, andcalc_analytic_css for the threecompartment steady state model ('3compartmentss') as used in Rotroff et al. (2010), Wetmore et al. (2012), Wetmore et al. (2015), and elsewhere. By assuming that enough time has passed to reach steady-state, weeliminate the need for tissue-specific parititon coefficients because we assume all tissues have come to equilibrium with the unbound concentrationin plasma. However, we still use chemical properties to predict the blood:plasma ratio for estimating first-pass hepatic metabolism for oralexposures.
Usage
parameterize_sumclearances( chem.cas = NULL, chem.name = NULL, dtxsid = NULL, species = "Human", clint.pvalue.threshold = 0.05, default.to.human = FALSE, physchem.exclude = TRUE, class.exclude = TRUE, force.human.clint.fup = FALSE, adjusted.Funbound.plasma = TRUE, adjusted.Clint = TRUE, restrictive.clearance = TRUE, fup.lod.default = 0.005, suppress.messages = FALSE, minimum.Funbound.plasma = 1e-04, Caco2.options = NULL, ...)Arguments
chem.cas | Chemical Abstract Services Registry Number (CAS-RN) – the chemical must be identified by either CAS, name, or DTXISD |
chem.name | Chemical name (spaces and capitalization ignored) – the chemical must be identified by either CAS, name, or DTXISD |
dtxsid | EPA's DSSTox Structure ID (https://comptox.epa.gov/dashboard)– the chemical must be identified by either CAS, name, or DTXSIDs |
species | Species desired (either "Rat", "Rabbit", "Dog", "Mouse", ordefault "Human"). |
clint.pvalue.threshold | Hepatic clearances with clearance assayshaving p-values greater than the threshold are set to zero. |
default.to.human | Substitutes missing species-specific values with human values ifTRUE (default is FALSE). |
physchem.exclude | Exclude chemicals on the basis of physico-chemicalproperties (currently only Henry's law constant) as specified by the relevant modelinfo_[MODEL] file (default TRUE). |
class.exclude | Exclude chemical classes identified as outside of domain of applicability by relevant modelinfo_[MODEL] file (default TRUE). |
force.human.clint.fup | Uses human hepatic intrinsic clearance and fractionof unbound plasma in calculation of partition coefficients for rats if true. |
adjusted.Funbound.plasma | Uses Pearce et al. (2017) lipid binding adjustmentfor Funbound.plasma (which impacts partition coefficients) when set to TRUE (Default). |
adjusted.Clint | Uses Kilford et al. (2008) hepatocyte incubationbinding adjustment for Clint when set to TRUE (Default). |
restrictive.clearance | In calculating hepatic.bioavailability, proteinbinding is not taken into account (set to 1) in liver clearance if FALSE. |
fup.lod.default | Default value used for fraction of unbound plasma forchemicals where measured value was below the limit of detection. Defaultvalue is 0.0005. |
suppress.messages | Whether or not the output message is suppressed. |
minimum.Funbound.plasma | Monte Carlo draws less than this value are set equal to this value (default is 0.0001 – half the lowest measured Fup in ourdataset). |
Caco2.options | A list of options to use when working with Caco2 apical to basolateral data |
... | Other parameters |
Details
We model systemic oral bioavailability as Fbio=Fabs*Fgut*Fhep.Fhepis estimated from in vitro TK data usingcalc_hep_bioavailability.If Fbiohas been measured in vivo and is found intablechem.physical_and_invitro.data then we set Fabs*Fgut to the measured value divided by Fhep Otherwise, if Caco2 membrane permeability data or predictionsare available Fabs is estimatedusingcalc_fabs.oral.Intrinsic hepatic metabolism is used to very roughly estimateFgutusingcalc_fgut.oral.
Per- and polyfluoroalkyl substances (PFAS) are excluded by default because the transporters that often drive PFAS toxicokinetics are not included in this model. However, PFAS chemicals can be included with the argument "class.exclude = FALSE".
Value
Clint | Hepatic Intrinsic Clearance, uL/min/10^6 cells. |
Fabsgut | Fraction of the oral dose absorbed and surviving gut metabolism, that is, the fraction of the dose that enters the gutlumen. |
Funbound.plasma | Fraction of plasma that is not bound. |
Qtotal.liverc | Flow rate of blood exiting the liver, L/h/kg BW^3/4. |
Qgfrc | Glomerular Filtration Rate, L/h/kgBW^3/4, volume of fluid filtered from kidney and excreted. |
BW | Body Weight, kg |
MW | Molecular Weight, g/mol |
million.cells.per.gliver | Millions cells per gram of liver tissue. |
Vliverc | Volume of the liver per kg body weight, L/kg BW. |
liver.density | Liver tissue density, kg/L. |
Fhep.assay.correction | The fraction of chemical unbound in hepatocyteassay using the method of Kilford et al. (2008) |
hepatic.bioavailability | Fraction of dose remaining after first passclearance, calculated from the corrected well-stirred model. |
Author(s)
John Wambaugh
References
Pearce RG, Setzer RW, Strope CL, Wambaugh JF, Sipes NS (2017).“Httk: R package for high-throughput toxicokinetics.”Journal of Statistical Software,79(4), 1.doi:10.18637/jss.v079.i04.
Kilford PJ, Gertz M, Houston JB, Galetin A (2008).“Hepatocellular binding of drugs: correction for unbound fraction in hepatocyte incubations using microsomal binding or drug lipophilicity data.”Drug Metabolism and Disposition,36(7), 1194–1197.doi:10.1124/dmd.108.020834.
Wambaugh JF, Schacht CM, Ring CL (2025).“A Simple Physiologically Based Toxicokinetic Model for Multi-Route In Vitro–In Vivo Extrapolation.”Environmental Science & Technology Letters,12(3), 261–268.doi:10.1021/acs.estlett.4c00967.
Rotroff DM, Wetmore BA, Dix DJ, Ferguson SS, Clewell HJ, Houck KA, LeCluyse EL, Andersen ME, Judson RS, Smith CM, others (2010).“Incorporating human dosimetry and exposure into high-throughput in vitro toxicity screening.”Toxicological Sciences,117(2), 348–358.doi:10.1093/toxsci/kfq220.
Wetmore BA, Wambaugh JF, Ferguson SS, Sochaski MA, Rotroff DM, Freeman K, Clewell III HJ, Dix DJ, Andersen ME, Houck KA, others (2012).“Integration of dosimetry, exposure, and high-throughput screening data in chemical toxicity assessment.”Toxicological Sciences,125(1), 157–174.doi:10.1093/toxsci/kfr254.
Wetmore BA, Wambaugh JF, Allen B, Ferguson SS, Sochaski MA, Setzer RW, Houck KA, Strope CL, Cantwell K, Judson RS, others (2015).“Incorporating high-throughput exposure predictions with dosimetry-adjusted in vitro bioactivity to inform chemical toxicity testing.”Toxicological Sciences,148(1), 121–136.doi:10.1093/toxsci/kfv171.
See Also
Examples
parameters <- parameterize_steadystate(chem.name='Bisphenol-A',species='Rat') parameters <- parameterize_steadystate(chem.cas='80-05-7')Parameters for a three-compartment model at steady-state with exhalation and resorption
Description
This function initializes the parameters needed in the functionscalc_mc_css,calc_mc_oral_equiv, andcalc_analytic_css for the PFAS-aware version of thesum of clearances model ("sumclearancespfas"). The model is described inWambaugh et al. (in preparation). For PFAS compounds the effectiveness of glomerular filtration in the kidneysis set according to the half-life predicted by the Dawson et al. (2023)model.By assuming that enough time has passed to reach steady-state, weeliminate the need for tissue-specific partition coefficients because we assume all tissues have come to equilibrium with the unbound concentrationin plasma. However, we still use chemical properties to predict the blood:plasma ratio for estimating first-pass hepatic metabolism for oralexposures.
Usage
parameterize_sumclearancespfas( chem.cas = NULL, chem.name = NULL, dtxsid = NULL, species = "Human", sex = "Female", dosingadj = "Oral", restrict.doa = "ClassModDomain", clint.pvalue.threshold = 0.05, default.to.human = FALSE, class.exclude = TRUE, physchem.exclude = TRUE, force.human.clint.fup = FALSE, adjusted.Funbound.plasma = TRUE, adjusted.Clint = TRUE, restrictive.clearance = TRUE, fup.lod.default = 0.005, suppress.messages = FALSE, minimum.Funbound.plasma = 1e-04, Caco2.options = NULL)Arguments
chem.cas | Chemical Abstract Services Registry Number (CAS-RN) – the chemical must be identified by either CAS, name, or DTXISD |
chem.name | Chemical name (spaces and capitalization ignored) – the chemical must be identified by either CAS, name, or DTXISD |
dtxsid | EPA's DSSTox Structure ID (https://comptox.epa.gov/dashboard)– the chemical must be identified by either CAS, name, or DTXSIDs |
species | Species desired (either "Rat", "Rabbit", "Dog", "Mouse", ordefault "Human"). |
sex | Sex of simulated individual ("Male" or "Female") |
dosingadj | Route of dosing for Dawson et al. (2023) PFAS half-life model("oral", "iv", or "other") |
restrict.doa | Whether to restrict to chemicals within an estimateddomain of applicability based on the properties of the training set("ClassModDomain"), the domain of all models ("AMAD"), or none ("none")(Defaults to "ClassModDomain"). |
clint.pvalue.threshold | Hepatic clearances with clearance assayshaving p-values greater than the threshold are set to zero. |
default.to.human | Substitutes missing species-specific values with human values ifTRUE (default is FALSE). |
class.exclude | Exclude chemical classes identified as outside of domain of applicability by relevant modelinfo_[MODEL] file (default TRUE). |
physchem.exclude | Exclude chemicals on the basis of physico-chemicalproperties (currently only Henry's law constant) as specified by the relevant modelinfo_[MODEL] file (default TRUE). |
force.human.clint.fup | Uses human hepatic intrinsic clearance and fractionof unbound plasma in calculation of partition coefficients for rats if true. |
adjusted.Funbound.plasma | Uses Pearce et al. (2017) lipid binding adjustmentfor Funbound.plasma (which impacts partition coefficients) when set to TRUE (Default). |
adjusted.Clint | Uses Kilford et al. (2008) hepatocyte incubationbinding adjustment for Clint when set to TRUE (Default). |
restrictive.clearance | In calculating hepatic.bioavailability, proteinbinding is not taken into account (set to 1) in liver clearance if FALSE. |
fup.lod.default | Default value used for fraction of unbound plasma forchemicals where measured value was below the limit of detection. Defaultvalue is 0.0005. |
suppress.messages | Whether or not the output message is suppressed. |
minimum.Funbound.plasma | Monte Carlo draws less than this value are set equal to this value (default is 0.0001 – half the lowest measured Fup in ourdataset). |
Caco2.options | A list of options to use when working with Caco2 apical to basolateral data |
Details
We model systemic oral bioavailability as Fbio=Fabs*Fgut*Fhep.Fhepis estimated from in vitro TK data usingcalc_hep_bioavailability.If Fbiohas been measured in vivo and is found intablechem.physical_and_invitro.data then we set Fabs*Fgut to the measured value divided by Fhep Otherwise, if Caco2 membrane permeability data or predictionsare available Fabs is estimatedusingcalc_fabs.oral.Intrinsic hepatic metabolism is used to very roughly estimateFgutusingcalc_fgut.oral.
Value
Clint | Hepatic Intrinsic Clearance, uL/min/10^6 cells. |
Fabsgut | Fraction of the oral dose absorbed, i.e. the fraction of thedose that enters the gutlumen. |
Funbound.plasma | Fraction of plasma that is not bound. |
Qtotal.liverc | Flow rate of blood exiting the liver, L/h/kg BW^3/4. |
Qgfrc | Glomerular Filtration Rate, L/h/kgBW^3/4, volume of fluid filtered from kidney and excreted. |
BW | Body Weight, kg |
MW | Molecular Weight, g/mol |
million.cells.per.gliver | Millions cells per gram of liver tissue. |
Vliverc | Volume of the liver per kg body weight, L/kg BW. |
liver.density | Liver tissue density, kg/L. |
Fhep.assay.correction | The fraction of chemical unbound in hepatocyteassay using the method of Kilford et al. (2008) |
hepatic.bioavailability | Fraction of dose remaining after first passclearance, calculated from the corrected well-stirred model. |
Author(s)
John Wambaugh
References
Pearce RG, Setzer RW, Strope CL, Wambaugh JF, Sipes NS (2017).“Httk: R package for high-throughput toxicokinetics.”Journal of Statistical Software,79(4), 1.doi:10.18637/jss.v079.i04.
Kilford PJ, Gertz M, Houston JB, Galetin A (2008).“Hepatocellular binding of drugs: correction for unbound fraction in hepatocyte incubations using microsomal binding or drug lipophilicity data.”Drug Metabolism and Disposition,36(7), 1194–1197.doi:10.1124/dmd.108.020834.
Dawson DE, Lau C, Pradeep P, Sayre RR, Judson RS, Tornero-Velez R, Wambaugh JF (2023).“A machine learning model to estimate toxicokinetic half-lives of per-and polyfluoro-alkyl substances (PFAS) in multiple species.”Toxics,11(2), 98.
See Also
Pearce et al. 2017 data
Description
This table includes the adjusted and unadjusted regression parameterestimates for the chemical-specifc plasmaprotein unbound fraction (fup) in 12 different tissue types.
Usage
pearce2017regressionFormat
data.frame
Details
Predictions were made with regression models, as reported in Pearce et al. (2017).
Author(s)
Robert G. Pearce
Source
Pearce et al. 2017 Regression Models
References
Pearce RG, Setzer RW, Davis JL, Wambaugh JF (2017).“Evaluation and calibration of high-throughput predictions of chemical distribution to tissues.”Journal of pharmacokinetics and pharmacodynamics,44, 549–565.doi:10.1007/s10928-017-9548-7.
See Also
Interspecies In vivo Clearance Data for PFAS
Description
If the chemical- and species-specific TK half-life (t_{1/2}) and volume of distribution (V_{d}) are known, a whole-body plasma clearance rate can be calculated as:
Cl_{tot} = ln(1/2) / t_{1/2} * V_{d}
The first term involving the natural logarithm of 1/2 converts half-life (h) into an elimination rate (1/h) so thatCl_{tot} has units of L/kg bodyweight/h. Dawson et al. (2023) reported a table of in vivo PFASt_{1/2} data for multiple species across eleven PFAS. Most of the measured data are for rodents. Thesedata result from a series of reviews of the literature by Lau et al. (most recently Fenton et al. 2021) that were further revised forDawson et al. (2023).Dawson et al. (2023) Supplemental Information S2.5 compiledV_{d}values that were used here for calculating total clearance. A dataset of literature-derived values ofV_{d} was compiled starting from Pizzurro et al. (2019) Table 2, which compiled 38 observations spanning five PFAS chemicals, four species, and both sexes from various literature sources. To these we added 24 calculatedV_{d} observations in rat for three chemicals across a range of doses and routes from Huang et al. (2019). Further values forV_{d} were collected from the peer-review literature (Dzierlenga et al. 2020; Lau et al. 2020; Lou et al. 2009; Tatum-Gibbs et al. 2011).The total data set includes 128 values forV_{d} from 8 PFAS chemicals across 4 species. ACl_{tot} was calculated using the above equation for every chemical- and species-specific half-life reported in theDawson et al. (2023) supplemental materials. For chemicals withoutspecies- and compound-specific measurements forV_{d} we used the medianin vivo measured PFAS Vd of 0.205 L/kg BW.
Usage
pfas.clearanceFormat
data.frame
Details
The data.frame contains the following columns:
| Column Name | Description |
| DTXSID | CompTox Chemicals Dashboard substance identifier |
| Species | Species for which the clearance was calculated |
| Sex | Sex for which the clearance was calculated |
| HalfLifeHours | Half-life in hours |
| HlReference | Reference(s) for half-life |
| VdLpkgbw | Volume of distribution in L/kg body weight |
| VdReference | Reference for volume of distribution |
| Kelimph | Elimination rate in 1/hour |
| ClLphpkgbw | Total clearance in L/h/kg body weight |
References
Dawson DE, Lau C, Pradeep P, Sayre RR, Judson RS, Tornero-Velez R, Wambaugh JF (2023).“A machine learning model to estimate toxicokinetic half-lives of per-and polyfluoro-alkyl substances (PFAS) in multiple species.”Toxics,11(2), 98.
Fenton SE, Ducatman A, Boobis A, DeWitt JC, Lau C, Ng C, Smith JS, Roberts SM (2021).“Per-and polyfluoroalkyl substance toxicity and human health review: Current state of knowledge and strategies for informing future research.”Environmental toxicology and chemistry,40(3), 606–630.
Pizzurro DM, Seeley M, Kerper LE, Beck BD (2019).“Interspecies differences in perfluoroalkyl substances (PFAS) toxicokinetics and application to health-based criteria.”Regulatory Toxicology and Pharmacology,106, 239–250.
Huang MC, Dzierlenga AL, Robinson VG, Waidyanatha S, DeVito MJ, Eifrid MA, Granville CA, Gibbs ST, Blystone CR (2019).“Toxicokinetics of perfluorobutane sulfonate (PFBS), perfluorohexane-1-sulphonic acid (PFHxS), and perfluorooctane sulfonic acid (PFOS) in male and female Hsd: Sprague Dawley SD rats after intravenous and gavage administration.”Toxicology reports,6, 645–655.
Dzierlenga AL, Robinson VG, Waidyanatha S, DeVito MJ, Eifrid MA, Gibbs ST, Granville CA, Blystone CR (2020).“Toxicokinetics of perfluorohexanoic acid (PFHxA), perfluorooctanoic acid (PFOA) and perfluorodecanoic acid (PFDA) in male and female Hsd: Sprague dawley SD rats following intravenous or gavage administration.”Xenobiotica,50(6), 722–732.
Lau C, Rumpler J, Das KP, Wood CR, Schmid JE, Strynar MJ, Wambaugh JF (2020).“Pharmacokinetic profile of Perfluorobutane Sulfonate and activation of hepatic nuclear receptor target genes in mice.”Toxicology,441, 152522.
Lou I, Wambaugh JF, Lau C, Hanson RG, Lindstrom AB, Strynar MJ, Zehr RD, Setzer RW, Barton HA (2009).“Modeling single and repeated dose pharmacokinetics of PFOA in mice.”Toxicological Sciences,107(2), 331–341.
Tatum-Gibbs K, Wambaugh JF, Das KP, Zehr RD, Strynar MJ, Lindstrom AB, Delinsky A, Lau C (2011).“Comparative pharmacokinetics of perfluorononanoic acid in rat and mouse.”Toxicology,281(1-3), 48–55.
Species-specific physiology parameters
Description
This data set contains values from Davies and Morris (1993) necessary toparamaterize a toxicokinetic model for human, mouse, rat, dog, or rabbit.The temperature for each species are taken from Reece (2015),Jordon (1995), and Stammers (1926). Mean residence time for the small intestine is from Grandoni et al. (2019). Human small intestine radius isfrom Yu et al. (1999). Rat small intestine radius is from Griffin andO'Driscoll (2008).
Usage
physiology.dataFormat
A data.frame containing 18 rows and 7 columns.
Author(s)
John Wambaugh and Nisha Sipes
References
Davies B, Morris T (1993).“Physiological parameters in laboratory animals and humans.”Pharmaceutical research,10(7), 1093–1095.doi:10.1023/A:1018943613122.
Brown RP, Delp MD, Lindstedt SL, Rhomberg LR, Beliles RP (1997).“Physiological parameter values for physiologically based pharmacokinetic models.”Toxicology and industrial health,13(4), 407–484.doi:10.1177/074823379701300401.
Birnbaum L, Brown R, Bischoff K, Foran J, Blancato J, Clewell H, Dedrick R (1994).“Physiological parameter values for PBPK models.”International Life Sciences Institute, Risk Science Institute, Washington, DC.
Reece WO (2015).“14 Body Temperature and Its Regulation.”Dukes' physiology of domestic animals, 149.
Stammers AD (1926).“The blood count and body temperature in normal rats.”The Journal of Physiology,61(3), 329.doi:10.1113/jphysiol.1926.sp002297.
Jordan D (1995).“Temperature regulation in laboratory rodents.”Journal of anatomy,186(Pt 1), 228.
Grandoni S, Cesari N, Brogin G, Puccini P, Magni P (2019).“Building in-house PBPK modelling tools for oral drug administration from literature information.”ADMET and DMPK,7(1), 4–21.doi:10.5599/admet.638.
Griffin B, O'Driscoll C (2008).“Models of the Small Intestine.”In Ehrhardt C, Kim K (eds.),Drug Absorption Studies: In Situ, In Vitro and In Silico Models, chapter 2, 34–76.Springer US, Boston, MA.ISBN 978-0-387-74901-3.doi:10.1007/978-0-387-74901-3_2.
Examples
# We can add a new species (for example, wolverines) by adding new information# to the physiology.data and tissue.data tables. It can be convenient to start by# by replicating the data from another species and adjusting as appropriate:# Copy physiology data from rabbit:new.species <- physiology.data[,"Rabbit"]names(new.species) <- physiology.data[,"Parameter"]rabbit.BW <- new.species["Average BW"] # Rausch and Pearson (1972) https://doi.org/10.2307/3799057 :new.species["Average BW"] <- 31.2 # Thiel et al. (2019) https://doi.org/10.1186/s12983-019-0319-8 :new.species["Average Body Temperature"] <- 38.5 # Add new physiology data column to physiology.data table"physiology.data <- cbind(physiology.data, new.species)colnames(physiology.data)[length(colnames(physiology.data))] <- "Wolverine"# Copy tissue data from rabbit:new.tissue.data <- subset(tissue.data,Species=="Rabbit")new.tissue.data$Species <- "Wolverine"# Add new tissue data rows to tissue.data table:tissue.data <- rbind(tissue.data, new.tissue.data)# Species is now available for calculations:calc_mc_css(chem.cas="80-05-7", species="wolverine", parameterize.args.list =list(default.to.human=TRUE), suppress.messages=TRUE, samples = 100)Pradeep et al. 2020
Description
This table includes Support Vector Machine and Random Forest model predictedvalues for unbound fraction plasma protein (fup) and intrinsic hepaticclearance (clint) values for a subset of chemicals in the Tox21 library(seehttps://www.epa.gov/chemical-research/toxicology-testing-21st-century-tox21).
Usage
pradeep2020Format
data.frame
Details
Prediction were made with Support Vector Machine and Random Forest models,as reported in Pradeep et al. (2020).
References
Pradeep P, Patlewicz G, Pearce R, Wambaugh J, Wetmore B, Judson R (2020).“Using chemical structure information to develop predictive models for in vitro toxicokinetic parameters to inform high-throughput risk-assessment.”Computational Toxicology,16, 100136.ISSN 2468-1113.doi:10.1016/j.comtox.2020.100136.
See Also
Predict partition coefficients using the method from Schmitt (2008).
Description
This function implements the method from Schmitt (2008) for predicting the tissue to unbound plasma partition coefficients for the tissues contained in thetissue.data table. The method has been modifiedby Pearce et al. (2017) based on an evaluation using in vivo measured partition coefficients.
To understand this method, it is important to recognize that in a given media the fraction unbound in that media is inverse of the media:water partition coefficient. In Schmitt's model, each tissue is composed of cells andinterstitium, with each cell consisting of neutral lipid,neutral phospholipid, water, protein, and acidic phospholipid.Each tissue cell is defined as the sum of separatecompartments for each constituent, all of which partitionwith a shared water compartment. The partitioning betweenthe cell components and cell water is compound specificand determined by log Pow (in neutral lipid partitioning),membrane affinity (phospholipid and protein partitioning),and pKa (neutral lipid and acidic phospholipid partitioning).For a given compound the partitioning into eachcomponent is identical across tissues. Thus the differencesamong tissues are driven by their composition, that is, thevarying volumes of components such as neutral lipid.However, pH differences across tissues also determinesmall differences in partitioning between cell and plasmawater. The fup is used as the plasma water to total plasmapartition coefficient and to approximate the partitioningbetween interstitial protein and water.
A regression is used to predict membrane affinity when measured values are not available (calc_ma). Theregressions for correcting each tissue are performed on tissue plasmapartition coefficients (Ktissue2pu * Funbound.plasma) calculated with thecorrected Funbound.plasma value and divided by this value to get Ktissue2pu.Thus the regressions should be used with the corrected Funbound.plasma.
A separate regression is used when adjusted.Funbound.plasma is FALSE.
The red blood cell regression can be used but is not by default because ofthe span of the data used for evaluation, reducing confidence in the regression for higher and lower predicted values.
Human tissue volumes are used for species other than Rat.
Usage
predict_partitioning_schmitt( chem.name = NULL, chem.cas = NULL, dtxsid = NULL, species = "Human", model = "pbtk", default.to.human = FALSE, parameters = NULL, alpha = 0.001, adjusted.Funbound.plasma = TRUE, regression = TRUE, regression.list = c("brain", "adipose", "gut", "heart", "kidney", "liver", "lung", "muscle", "skin", "spleen", "bone"), tissues = NULL, minimum.Funbound.plasma = 1e-04, suppress.messages = FALSE)Arguments
chem.name | Either the chemical name or the CAS number must bespecified. |
chem.cas | Either the chemical name or the CAS number must bespecified. |
dtxsid | EPA's DSSTox Structure ID (https://comptox.epa.gov/dashboard)the chemical must be identified by either CAS, name, or DTXSIDs |
species | Species desired (either "Rat", "Rabbit", "Dog", "Mouse", ordefault "Human"). |
model | Model for which partition coefficients are neeeded (for example,"pbtk", "3compartment") |
default.to.human | Substitutes missing animal values with human valuesif true (hepatic intrinsic clearance or fraction of unbound plasma). |
parameters | Chemical parameters from |
alpha | Ratio of Distribution coefficient D of totally charged speciesand that of the neutral form |
adjusted.Funbound.plasma | Whether or not to use Funbound.plasmaadjustment. |
regression | Whether or not to use the regressions. Regressions areused by default. |
regression.list | Tissues to use regressions on. |
tissues | Vector of desired partition coefficients. Returns all bydefault. |
minimum.Funbound.plasma | Monte Carlo draws less than this value are set equal to this value (default is 0.0001 – half the lowest measured Fup in ourdataset). |
suppress.messages | Whether or not the output message is suppressed. |
Value
Returns tissue to unbound plasma partition coefficients for eachtissue.
Author(s)
Robert Pearce
References
Schmitt W (2008).“General approach for the calculation of tissue to plasma partition coefficients.”Toxicology in vitro,22(2), 457–467.doi:10.1016/j.tiv.2007.09.010.
Birnbaum L, Brown R, Bischoff K, Foran J, Blancato J, Clewell H, Dedrick R (1994).“Physiological parameter values for PBPK models.”International Life Sciences Institute, Risk Science Institute, Washington, DC.
Pearce RG, Setzer RW, Davis JL, Wambaugh JF (2017).“Evaluation and calibration of high-throughput predictions of chemical distribution to tissues.”Journal of pharmacokinetics and pharmacodynamics,44, 549–565.doi:10.1007/s10928-017-9548-7.
Yun YE, Edginton AN (2013).“Correlation-based prediction of tissue-to-plasma partition coefficients using readily available input parameters.”Xenobiotica,43(10), 839–852.doi:10.3109/00498254.2013.770182.
See Also
Examples
library(httk)# Predict the partition coefficients by chemical id:PCs1 <- predict_partitioning_schmitt(chem.name='ibuprofen')# Create a list of parameters (that you can potentially change):p <- parameterize_schmitt(chem.name="ibuprofen")# Predict the partition coefficients using a list of parameters:PCs2 <- predict_partitioning_schmitt(parameters = p)# Check that all the parameter values are the same:all(unlist(PCs1)==unlist(PCs2))# Predict partition coefficients without using Pearce et al. (2017) calibrations:PCs3 <- predict_partitioning_schmitt(chem.name='ibuprofen',regression=FALSE)# Lump the tissues into the compartments for model "pbtk":lump_tissues(PCs1)# Lump the tissues into a single volume of distributioncalc_vdist(parameters=c(p,PCs1))Propagates uncertainty and variability in in vitro HTTK data into onecompartment model parameters
Description
Propagates uncertainty and variability in in vitro HTTK data into onecompartment model parameters
Usage
propagate_invitrouv_1comp(parameters.dt, ...)Arguments
parameters.dt | The data table of parameters being used by the MonteCarlo sampler |
... | Additional arguments passed to |
Value
A data.table whose columns are the parameters of the HTTK modelspecified inmodel.
Author(s)
John Wambaugh
Propagates uncertainty and variability in in vitro HTTK data into threecompartment model parameters
Description
Propagates uncertainty and variability in in vitro HTTK data into threecompartment model parameters
Usage
propagate_invitrouv_3comp(parameters.dt, ...)Arguments
parameters.dt | The data table of parameters being used by the MonteCarlo sampler |
... | Additional arguments passed to |
Value
A data.table whose columns are the parameters of the HTTK modelspecified inmodel.
Author(s)
John Wambaugh
Propagates uncertainty and variability in in vitro HTTK data into PBPKmodel parameters
Description
Propagates uncertainty and variability in in vitro HTTK data into PBPKmodel parameters
Usage
propagate_invitrouv_pbtk(parameters.dt, ...)Arguments
parameters.dt | The data table of parameters being used by the MonteCarlo sampler |
... | Additional arguments passed to |
Value
A data.table whose columns are the parameters of the HTTK modelspecified inmodel.
Author(s)
John Wambaugh
Returns draws from a normal distribution with a lower censoring limit of lod(limit of detection)
Description
Returns draws from a normal distribution with a lower censoring limit of lod(limit of detection)
Usage
r_left_censored_norm(n, mean = 0, sd = 1, lod = 0.005, lower = 0, upper = 1)Arguments
n | Number of samples to take |
mean | Mean of censored distribution. Default 0. |
sd | Standard deviation of censored distribution. Default 1. |
lod | Bound below which to censor. Default 0.005. |
lower | Lower bound on censored distribution. Default 0. |
upper | Upper bound on censored distribution. Default 1. |
Value
A vector of samples from the specified censored distribution.
Reset HTTK to Default Data Tables
Description
This function returns an updated version of chem.physical_and_invitro.datathat includes data predicted with Simulations Plus' ADMET predictor that wasused in Sipes et al. 2017, included in admet.data.
Usage
reset_httk(target.env = .GlobalEnv)Arguments
target.env | The environment where the newchem.physical_and_invitro.data is loaded. Defaults to global environment. |
Value
data.frame | The package default version of chem.physical_and_invitro.data. |
Author(s)
John Wambaugh
Examples
chem.physical_and_invitro.data <- load_sipes2017()reset_httk()Randomly draws from a one-dimensional KDE
Description
Randomly draws from a one-dimensional KDE
Usage
rfun(n, fhat)Arguments
n | Number of samples to draw |
fhat | A list with elements x, w, and h (h is the KDE bandwidth). |
Value
A vector of n samples from the KDE fhat
Author(s)
Caroline Ring
References
Ring CL, Pearce RG, Setzer RW, Wetmore BA, Wambaugh JF (2017).“Identifying populations sensitive to environmental chemicals by simulating toxicokinetic variability.”Environment International,106, 105–118.doi:10.1016/j.envint.2017.06.004.
Draw random numbers with LOD median but non-zero upper 95th percentile
Description
This function draws N random numbers from a distribution that approximatesa median that is equal to the limit of detection (LOD, value x.LOD) but has an upper 95th percentile (x.u95) that is above x.LOD. We make the assumption that values above x.u95 are uniformly distributed between x.u95 and x.u95 +(x.u95 - x.LOD)
Usage
rmed0non0u95(n, x.u95, x.min = 0, x.LOD = 0.005)Arguments
n | Number of samples to draw |
x.u95 | The upper limit on the 95th confidence/credible intervale (thisis the 97.5 percentile) |
x.min | The minimum allowed value (defaults to 0) |
x.LOD | The limit of detection (defaults to 0.005) |
Value
A vector of N samples where the 50th and 97.5th quantiles approximatex.LOD and x.u95 respectively
Author(s)
John Wambaugh
References
Breen M, Wambaugh JF, Bernstein A, Sfeir M, Ring CL (2022).“Simulating toxicokinetic variability to identify susceptible and highly exposed populations.”Journal of Exposure Science & Environmental Epidemiology,32(6), 855–863.doi:10.1038/s41370-022-00491-0.
Examples
Fup.95 <- 0.02N <- 1000set.seed(1235)Fup.vec <- rmed0non0u95(n=N, x.u95=Fup.95)quantile(Fup.vec,c(0.5,0.975))quantile(rmed0non0u95(200,x.u95=0.05,x.min=10^-4,x.LOD=0.01),c(0.5,0.975))hist(rmed0non0u95(1000,x.u95=0.05,x.min=10^-4,x.LOD=0.01))quantile(rmed0non0u95(200,x.u95=0.005,x.min=10^-4,x.LOD=0.01),c(0.5,0.975))hist(rmed0non0u95(1000,x.u95=0.005,x.min=10^-4,x.LOD=0.01))Scale mg/kg body weight doses according to body weight and units
Description
This function transforms the dose (in mg/kg) into the appropriate units. Ithandles single doses, matrices of doses, or daily repeated doses at varyingintervals. Gut absorption is also factored in through the parameter Fabsgut,and scaling is currently avoided in the inhalation exposure case with a scale factor of 1
Usage
scale_dosing( dosing, parameters, route, input.units = NULL, output.units = "uM", vol = NULL, state = "liquid")Arguments
dosing | List of dosing metrics used in simulation, which must includethe general entries with names "initial.dose", "doses.per.day", "daily.dose", and "dosing.matrix". The "dosing.matrix" is used for moreprecise dose regimen specification, and is a matrix consisting of twocolumns or rows named "time" and "dose" containing the time and amount,in mg/kg BW, of each dose. The minimal usage case involves all entries but"initial.dose" set to NULL in value. |
parameters | Chemical parameters from parameterize_pbtk function,overrides chem.name and chem.cas. |
route | String specification of route of exposure for simulation:"oral", "iv", "inhalation", ... |
input.units | Units of the dose values being scaled. (Default is NULL.) Currently supported units "mg/L", "ug/L","ug/mL", "uM", "umol/L", "ug/dL","ug/g", "nmol/L", "nM", and "ppmw" (supported input.units subject to change). |
output.units | Desired units (either "mg/L", "mg", "umol", or default"uM"). |
vol | Volume for the target tissue of interest.NOTE: Volume should not be in units of per BW, i.e. "kg". |
state | Chemical state of matter (gas or default liquid). |
Value
A list of numeric values for doses converted to output.units, potentially(depending on argument dosing) including:
initial.dose | The first dose given |
dosing.matrix | A 2xN matrix where the first column is dose time andthe second is dose amount for N doses |
daily.dose | The total cumulative daily dose |
Author(s)
John Wambaugh and Sarah E. Davidson
KDE bandwidths for residual variability in serum creatinine
Description
Bandwidths used for a one-dimensional kernel density estimation of thedistribution of residual errors around smoothing spline fits of serumcreatinine vs. age for NHANES respondents in each of ten combinations of sexand race/ethnicity categories.
Usage
scr_hFormat
A named list with 10 elements, each a numeric value. Each list elementcorresponds to, and is named for, one combination of NHANES sex categories(Male and Female) and NHANES race/ethnicity categories (Mexican American,Other Hispanic, Non-Hispanic White, Non-Hispanic Black, and Other).
Details
Each matrix is the standard deviation for a normal distribution: this is thebandwidth to be used for a kernel density estimation (KDE) (using a normalkernel) of the distribution of residual errors around smoothing spline fits ofserum creatinine vs. age for NHANES respondents in the specified sex andrace/ethnicity category. Optimal bandwidths were pre-calculated by doing thesmoothing spline fits, getting the residuals, then callingkde on the residuals (which callshpi tocompute the plug-in bandwidth).
Used by HTTK-Pop only in "virtual individuals" mode (i.e.httkpop_generate withmethod = "v"), ingen_serum_creatinine.
Author(s)
Caroline Ring
References
Ring CL, Pearce RG, Setzer RW, Wetmore BA, Wambaugh JF (2017).“Identifying populations sensitive to environmental chemicals by simulating toxicokinetic variability.”Environment International,106, 105–118.doi:10.1016/j.envint.2017.06.004.
set_httk_precision
Description
Although the ODE solver and other functions return very precise numbers,we cannot (or at least do not spend enough computing time to) be sure of the precioion to an arbitrary level. This function both limits the number ofsignficant figures reported and truncates the numerical precision.
Usage
set_httk_precision(in.num, sig.fig = 4, num.prec = 9)Arguments
in.num | The numeric variable (or assembly of numerics) to beprocessed. |
sig.fig | The number of significant figures reported. Defaults to 4. |
num.prec | The precision maintained, digits below 10^num.prec are dropped. Defaults to 9. |
Value
numeric values
Author(s)
John Wambaugh
Sipes et al. 2017 data
Description
This table includes in silico predicted chemical-specifc plasma protein unbound fraction (fup) and intrinsic hepatic clearance values for the entireTox21 library (seehttps://www.epa.gov/chemical-research/toxicology-testing-21st-century-tox21). Predictions were made with Simulations Plus ADMET predictor,as reported in Sipes et al. (2017).
Usage
sipes2017Format
data.frame
Author(s)
Nisha Sipes
Source
ADMET, Simulations Plus
References
Sipes NS, Wambaugh JF, Pearce R, Auerbach SS, Wetmore BA, Hsieh J, Shapiro AJ, Svoboda D, DeVito MJ, Ferguson SS (2017).“An intuitive approach for predicting potential human health risk with the Tox21 10k library.”Environmental science & technology,51(18), 10786–10796.doi:10.1021/acs.est.7b00650.
See Also
Predict skeletal muscle mass
Description
Predict skeletal muscle mass from age, height, and gender.
Usage
skeletal_muscle_mass(smm, age_years, height, gender)Arguments
smm | Vector of allometrically-scaled skeletal muscle masses. |
age_years | Vector of ages in years. |
height | Vector of heights in cm. |
gender | Vector of genders, either 'Male' or 'Female.' |
Details
For individuals over age 18, use allometrically-scaled muscle mass with anage-based scaling factor, to account for loss of muscle mass with age(Janssen et al. 2000). For individuals under age 18, useskeletal_muscle_mass_children.
Value
Vector of skeletal muscle masses in kg.
Author(s)
Caroline Ring
References
Janssen, Ian, et al. "Skeletal muscle mass and distribution in 468 men andwomen aged 18-88 yer." Journal of Applied Physiology 89.1 (2000): 81-88
Ring CL, Pearce RG, Setzer RW, Wetmore BA, Wambaugh JF (2017).“Identifying populations sensitive to environmental chemicals by simulating toxicokinetic variability.”Environment International,106, 105–118.doi:10.1016/j.envint.2017.06.004.
See Also
Predict skeletal muscle mass for children
Description
For individuals under age 18, predict skeletal muscle mass from gender andage, using a nonlinear equation from Webber and Barr (2012)
Usage
skeletal_muscle_mass_children(gender, age_years)Arguments
gender | Vector of genders (either 'Male' or 'Female'). |
age_years | Vector of ages in years. |
Value
Vector of skeletal muscle masses in kg.
Author(s)
Caroline Ring
References
Webber, Colin E., and Ronald D. Barr. "Age-and gender-dependent values of skeletal muscle mass in healthy children and adolescents." Journal of cachexia, sarcopenia and muscle 3.1 (2012): 25-29.
Ring CL, Pearce RG, Setzer RW, Wetmore BA, Wambaugh JF (2017).“Identifying populations sensitive to environmental chemicals by simulating toxicokinetic variability.”Environment International,106, 105–118.doi:10.1016/j.envint.2017.06.004.
Predict skin mass
Description
Using equation from Bosgra et al. 2012, predict skin mass from body surfacearea.
Usage
skin_mass_bosgra(BSA)Arguments
BSA | Vector of body surface areas in cm^2. |
Value
Vector of skin masses in kg.
Author(s)
Caroline Ring
References
Bosgra, Sieto, et al. "An improved model to predict physiologically based model parameters and their inter-individual variability from anthropometry." Critical reviews in toxicology 42.9 (2012): 751-767.
Ring CL, Pearce RG, Setzer RW, Wetmore BA, Wambaugh JF (2017).“Identifying populations sensitive to environmental chemicals by simulating toxicokinetic variability.”Environment International,106, 105–118.doi:10.1016/j.envint.2017.06.004.
Solve one compartment TK model
Description
This function solves for the amount or concentration of a chemical in plasmafor a one compartment model as a function of time based on the dose anddosing frequency. The model describes blood concentrations in a single compartment. The volume of distributiondepends on the physical volume of each tissue and the predicted chemical partitioning into those volumes. Plasma concentration in compartment x is given byC_{plasma} = \frac{C_{blood}}{R_{b2p}} for a tissue independent value ofR_{b2p}.
Usage
solve_1comp( chem.name = NULL, chem.cas = NULL, dtxsid = NULL, times = NULL, parameters = NULL, days = 10, tsteps = 4, daily.dose = NULL, dose = NULL, doses.per.day = NULL, initial.values = NULL, plots = FALSE, suppress.messages = FALSE, species = "Human", iv.dose = FALSE, input.units = "mg/kg", output.units = NULL, default.to.human = FALSE, class.exclude = TRUE, physchem.exclude = TRUE, recalc.blood2plasma = FALSE, recalc.clearance = FALSE, dosing.matrix = NULL, adjusted.Funbound.plasma = TRUE, regression = TRUE, restrictive.clearance = TRUE, minimum.Funbound.plasma = 1e-04, monitor.vars = NULL, Caco2.options = list(), ...)Arguments
chem.name | Either the chemical name, CAS number, or the parametersmust be specified. |
chem.cas | Either the chemical name, CAS number, or the parameters mustbe specified. |
dtxsid | EPA's 'DSSTox Structure ID (https://comptox.epa.gov/dashboard)the chemical must be identified by either CAS, name, or DTXSIDs |
times | Optional time sequence for specified number of days. |
parameters | Chemical parameters from parameterize_1comp function,overrides chem.name and chem.cas. |
days | Length of the simulation. |
tsteps | The number time steps per hour. |
daily.dose | Total daily dose, default is mg/kg BW. |
dose | Amount of a single dose, default is mg/kg BW. |
doses.per.day | Number of doses per day. |
initial.values | Vector containing the initial concentrations oramounts of the chemical in specified tissues with units corresponding tooutput.units. Defaults are zero. |
plots | Plots all outputs if true. |
suppress.messages | Whether or not the output message is suppressed. |
species | Species desired (either "Rat", "Rabbit", "Dog", or default"Human"). |
iv.dose | Simulates a single i.v. dose if true. |
input.units | Input units of interest assigned to dosing, defaults to"mg/kg" BW. |
output.units | A named vector of output units expected for the modelresults. Default, NULL, returns model results in units specified in the'modelinfo' file. See table below for details. |
default.to.human | Substitutes missing rat values with human values iftrue. |
class.exclude | Exclude chemical classes identified as outside of domain of applicability by relevant modelinfo_[MODEL] file (default TRUE). |
physchem.exclude | Exclude chemicals on the basis of physico-chemicalproperties (currently only Henry's law constant) as specified by the relevant modelinfo_[MODEL] file (default TRUE). |
recalc.blood2plasma | Whether or not to recalculate the blood:plasmachemical concentrationr ratio |
recalc.clearance | Whether or not to recalculate the eliminationrate. |
dosing.matrix | Vector of dosing times or a matrix consisting of twocolumns or rows named "dose" and "time" containing the time and amount, inmg/kg BW by default, of each dose. |
adjusted.Funbound.plasma | Uses adjusted Funbound.plasma when set toTRUE along with volume of distribution calculated with this value. |
regression | Whether or not to use the regressions in calculatingpartition coefficients in volume of distribution calculation. |
restrictive.clearance | In calculating elimination rate, proteinbinding is not taken into account (set to 1) in liver clearance if FALSE. |
minimum.Funbound.plasma | Monte Carlo draws less than this value are set equal to this value (default is 0.0001 – half the lowest measured Fup in ourdataset). |
monitor.vars | Which variables are returned as a function of time. Defaults value of NULL provides "Agutlumen", "Ccompartment", "Ametabolized","AUC" |
Caco2.options | A list of options to use when working with Caco2 apical to basolateral data |
... | Additional arguments passed to the integrator (deSolve). |
Details
Model Figure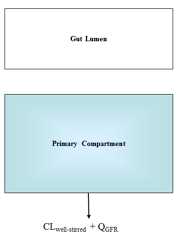 Note that the timescales for the model parameters have units of hours while the model output is in days.
Default value of NULL for doses.per.day solves for a single dose.
When species is specified as rabbit, dog, or mouse, the function uses theappropriate physiological data(volumes and flows) but substitutes humanfraction unbound, partition coefficients, and intrinsic hepatic clearance.
Because this model does not simulate exhalation, inhalation, and other processes relevant to volatile chemicals, this model is by default restricted to chemicals with a logHenry's Law Constant less than that of Acetone, a known volatile chemical. That is, chemicals with logHLC > -4.5 (Log10 atm-m3/mole) are excluded. Volatility is not purely determined by the Henry's Law Constant, therefore this chemical exclusion may be turned off with the argument "physchem.exclude = FALSE". Similarly, per- and polyfluoroalkyl substances (PFAS) are excluded by default because the transporters that often drive PFAS toxicokinetics are not included in this model. However, PFAS chemicals can be included with the argument "class.exclude = FALSE".
Value
A matrix with a column for time(in days) and a column for thecompartment and the area under the curve (concentration only).
Author(s)
Robert Pearce
References
Pearce RG, Setzer RW, Strope CL, Wambaugh JF, Sipes NS (2017).“Httk: R package for high-throughput toxicokinetics.”Journal of Statistical Software,79(4), 1.doi:10.18637/jss.v079.i04.
See Also
Examples
solve_1comp(chem.name='Bisphenol-A', days=1)# By storing the model parameters in a vector first, you can potentially# edit them before using the model:params <- parameterize_1comp(chem.cas="80-05-7")solve_1comp(parameters=params, days=1)head(solve_1comp(chem.name="Terbufos", daily.dose=NULL, dose=1, days=1))head(solve_1comp(chem.name="Terbufos", daily.dose=NULL, dose=1,days=1, iv.dose=TRUE))# A dose matrix specifies times and magnitudes of doses:dm <- matrix(c(0,1,2,5,5,5),nrow=3)colnames(dm) <- c("time","dose")solve_1comp(chem.name="Methenamine", dosing.matrix=dm, days=2.5, dose=NULL,daily.dose=NULL)solve_1comp(chem.name="Besonprodil", daily.dose=1, dose=NULL, days=2.5, doses.per.day=4)# The following will not work because Diquat dibromide monohydrate's # Henry's Law Constant (-3.912) is higher than that of Acetone (~-4.5):try(head(solve_1comp(chem.cas = "6385-62-2")))# However, we can turn off checking for phys-chem properties, since we know# that Diquat dibromide monohydrate is not too volatile:head(solve_1comp(chem.cas = "6385-62-2", physchem.exclude = FALSE))Solve1comp_lifestage model, which has time-dependent parameters
Description
This function solves for the amount or concentration of a chemical in plasmafor a one compartment model as a function of time based on the dose anddosing frequency.
Usage
solve_1comp_lifestage( chem.name = NULL, chem.cas = NULL, dtxsid = NULL, times = NULL, parameters = NULL, days = 10, tsteps = 4, daily.dose = NULL, dose = NULL, doses.per.day = NULL, initial.values = NULL, plots = FALSE, suppress.messages = FALSE, species = "Human", iv.dose = FALSE, output.units = "uM", method = "lsoda", rtol = 1e-08, atol = 1e-12, default.to.human = FALSE, recalc.blood2plasma = FALSE, recalc.clearance = FALSE, dosing.matrix = NULL, adjusted.Funbound.plasma = TRUE, regression = TRUE, restrictive.clearance = T, minimum.Funbound.plasma = 1e-04, monitor.vars = NULL, time.varying.params = TRUE, start.age = 360, ref.pop.dt = NULL, httkpop.generate.arg.list = list(method = "virtual individuals", nsamp = 25000), ref.params = NULL, ...)Arguments
chem.name | Either the chemical name, CAS number, or the parametersmust be specified. |
chem.cas | Either the chemical name, CAS number, or the parameters mustbe specified. |
dtxsid | EPA's 'DSSTox Structure ID (https://comptox.epa.gov/dashboard)the chemical must be identified by either CAS, name, or DTXSIDs |
times | Optional time sequence for specified number of days. |
parameters | Chemical parameters from parameterize_1comp function,overrides chem.name and chem.cas. |
days | Length of the simulation. |
tsteps | The number time steps per hour. |
daily.dose | Total daily dose, mg/kg BW. |
dose | Amount of a single dose, mg/kg BW. |
doses.per.day | Number of doses per day. |
initial.values | Vector containing the initial concentrations oramounts of the chemical in specified tissues with units corresponding tooutput.units. Defaults are zero. |
plots | Plots all outputs if true. |
suppress.messages | Whether or not the output message is suppressed. |
species | Species desired (either "Rat", "Rabbit", "Dog", or default"Human"). |
iv.dose | Simulates a single i.v. dose if true. |
output.units | Desired units (either "mg/L", "mg", "umol", or default"uM"). |
method | Method used by integrator (deSolve). |
rtol | Argument passed to integrator (deSolve). |
atol | Argument passed to integrator (deSolve). |
default.to.human | Substitutes missing rat values with human values iftrue. |
recalc.blood2plasma | Whether or not to recalculate the blood:plasmachemical concentration ratio |
recalc.clearance | Whether or not to recalculate the eliminationrate. |
dosing.matrix | Vector of dosing times or a matrix consisting of twocolumns or rows named "dose" and "time" containing the time and amount, inmg/kg BW, of each dose. |
adjusted.Funbound.plasma | Uses adjusted Funbound.plasma when set toTRUE along with volume of distribution calculated with this value. |
regression | Whether or not to use the regressions in calculatingpartition coefficients in volume of distribution calculation. |
restrictive.clearance | In calculating elimination rate, proteinbinding is not taken into account (set to 1) in liver clearance if FALSE. |
minimum.Funbound.plasma | Monte Carlo draws less than this value are set equal to this value (default is 0.0001 – half the lowest measured Fup in ourdataset). |
monitor.vars | Which variables are returned as a function of time. Defaults value of NULL provides "Agutlumen", "Ccompartment", "Ametabolized","AUC" |
time.varying.params | Whether or not to allow parameters to vary in time according to the nonparametric regression determined by |
start.age | The age of the individual in months at the beginning of thesimulation. Default 360. |
ref.pop.dt | The output of |
httkpop.generate.arg.list | If |
ref.params | Model parameters of a reference population used in determiningtimeseries. Recommended column binding ages in months (as |
... | Additional arguments passed to the integrator. |
Details
Note that the model parameters have units of hours while the model output isin days.
Default value of NULL for doses.per.day solves for a single dose.
When species is specified as rabbit, dog, or mouse, the function uses theappropriate physiological data(volumes and flows) but substitutes humanfraction unbound, partition coefficients, and intrinsic hepatic clearance.
AUC is area under plasma concentration curve.
Model Figure
Value
A matrix with a column for time(in days) and a column for thecompartment and the area under the curve (concentration only).
Author(s)
Colin Thomson
Examples
params <- parameterize_1comp(chem.name = 'Bisphenol A')pop.phys <- httkpop_generate(method = 'virtual individuals', nsamp = 25000, agelim_years = c(18, 79), weight_category = c("Normal"))pop.params <- create_mc_samples(chem.name = 'Bisphenol A', model = '1compartment', httkpop.dt = pop.phys)ref.params <- cbind(pop.params, age_months = pop.phys$age_months)out <- solve_1comp_lifestage(chem.name = 'Bisphenol A', parameters = params, days = 365, start.age = 600, # age fifty ref.params = ref.params, doses.per.day = 3, daily.dose = 1)Solve_1tri_PBTK
Description
This function solves for the amounts (in umol) or concentrations (in uM) of a chemicalin different tissues of a pregnant woman (and her conceptus, i.e., products of conception)as functions of time based on the dose and dosing frequency.
Usage
solve_1tri_pbtk( chem.name = NULL, chem.cas = NULL, dtxsid = NULL, times = seq(0, 13 * 7, 1), parameters = NULL, days = NULL, species = "human", tsteps = 4, dose = NULL, dosing.matrix = NULL, daily.dose = NULL, doses.per.day = NULL, initial.values = NULL, plots = FALSE, suppress.messages = FALSE, iv.dose = FALSE, input.units = "mg/kg", output.units = NULL, physchem.exclude = TRUE, class.exclude = TRUE, recalc.blood2plasma = FALSE, recalc.clearance = FALSE, adjusted.Funbound.plasma = TRUE, regression = TRUE, restrictive.clearance = TRUE, minimum.Funbound.plasma = 1e-04, monitor.vars = NULL, Caco2.options = list(), atol = 1e-08, rtol = 1e-08, ...)Arguments
chem.name | Either the chemical name, CAS number, or the parametersmust be specified. |
chem.cas | Either the chemical name, CAS number, or the parameters mustbe specified. |
dtxsid | EPA's DSSTox Structure ID (https://comptox.epa.gov/dashboard)the chemical must be identified by either CAS, name, or DTXSIDs |
times | Optional time sequence in days. Dosing sequence begins at thebeginning of times. Default is from 0th week of pregnancy to 13th due to model representation. |
parameters | Chemical parameters from parameterize_1tri_pbtk function,overrides chem.name and chem.cas. |
days | Length of the simulation. |
species | Included for compatibility with other functions, but the modelwill not run for non-human species (default "Human"). |
tsteps | The number time steps per hour. Default of 4. |
dose | Amount of a single, initial oral dose in mg/kg BW. |
dosing.matrix | A matrix of either one column (or row) with a set ofdosing times or with two columns (or rows) correspondingly named "dose" and"time" containing the time and amount, in mg/kg BW, of each dose. |
daily.dose | Total daily dose, mg/kg BW. |
doses.per.day | Number of doses per day. |
initial.values | Vector containing the initial concentrations oramounts of the chemical in specified tissues with units corresponding tocompartment.units. Defaults are zero. |
plots | Plots all outputs if true. |
suppress.messages | Whether or not the output message is suppressed. |
iv.dose | Simulates a single i.v. dose if true. |
input.units | Input units of interest assigned to dosing, defaults tomg/kg BW |
output.units | A named vector of output units expected for the modelresults. Default, NULL, returns model results in units specified in the'modelinfo' file. See table below for details. |
physchem.exclude | Exclude chemicals on the basis of physico-chemicalproperties (currently only Henry's law constant) as specified by the relevant modelinfo_[MODEL] file (default TRUE). |
class.exclude | Exclude chemical classes identified as outside of domain of applicability by relevant modelinfo_[MODEL] file (default TRUE). |
recalc.blood2plasma | Recalculates the ratio of the amount of chemicalin the blood to plasma using the input parameters, calculated withhematocrit, Funbound.plasma, and Krbc2pu. |
recalc.clearance | Recalculates the the hepatic clearance(Clmetabolism) with new million.cells.per.gliver parameter. |
adjusted.Funbound.plasma | Uses adjusted Funbound.plasma when set toTRUE along with partition coefficients calculated with this value. |
regression | Whether or not to use the regressions in calculatingpartition coefficients. |
restrictive.clearance | Protein binding not taken into account (set to1) in liver clearance if FALSE. |
minimum.Funbound.plasma | Monte Carlo draws less than this value are set equal to this value (default is 0.0001 – half the lowest measured Fup in ourdataset). |
monitor.vars | Which variables to track by default |
Caco2.options | A list of options to use when working with Caco2 apical to basolateral data |
atol | Argument passed to integrator (deSolve). |
rtol | Argument passed to integrator (deSolve). |
... | Additional arguments passed to the integrator. |
Details
The model begins by default at non-pregnancy (0th week) and ends at the 13th week of pregnancy, thereby simulating the 1st trimester. This is meant to augment the fetal_pbtk model (Kapraun et al. 2022) which is limited to the 13th to 40th week window.
Note that the model parameters have units of hours while the model output isin days. Dose is in mg, not scaled for body weight.
Default NULL value for doses.per.day solves for a single dose.
The maternal compartments used in this model are the gut lumen, gut, liver, venous blood, arterial blood, lung, adipose tissue, kidney, thyroid, and rest of body. The "conceptus" compartment models an early developing fetus along with the products of conception (i.e. placenta, amniotic fluid) through which chemical exchange can occur with the maternal blood.
The extra compartments include the amounts or concentrations metabolized bythe liver and excreted by the kidneys through the tubules.
AUC is the area under the curve of the plasma concentration.
This gestational model is only parameterized for humans.
Because this model does not simulate exhalation, inhalation, and other processes relevant to volatile chemicals, this model is by default restricted to chemicals with a logHenry's Law Constant less than that of Acetone, a known volatile chemical. That is, chemicals with logHLC > -4.5 (Log10 atm-m3/mole) are excluded. Volatility is not purely determined by the Henry's Law Constant, therefore this chemical exclusion may be turned off with the argument "physchem.exclude = FALSE". Similarly, per- and polyfluoroalkyl substances (PFAS) are excluded by default because the transporters that often drive PFAS toxicokinetics are not included in this model. However, PFAS chemicals can be included with the argument "class.exclude = FALSE".
Value
A matrix of class deSolve with a column for time(in days), eachcompartment, the area under the curve, and plasma concentration and a rowfor each time point.
Author(s)
Kimberly Truong, John Wambaugh, Mark Sfeir, Dustin Kapraun
References
Truong KT, Wambaugh JF, Kapraun DF, Davidson-Fritz SE, Eytcheson S, Judson RS, Paul Friedman K (2025).“Interpretation of thyroid-relevant bioactivity data for comparison to in vivo exposures: A prioritization approach for putative chemical inhibitors of in vitro deiodinase activity.”Toxicology.doi:10.1016/j.tox.2025.154157.
See Also
Examples
out = solve_1tri_pbtk(chem.name = 'Bisphenol-A', daily.dose = 1, doses.per.day = 3)Solve_3comp
Description
This function solves for the amounts or concentrations of a chemical inthe blood of three different compartments representing the body.The volumes of the three compartments are chemical specific, determined fromthe true tissue volumes multiplied by the partition coefficients:
V_{pv} = V_{gut}
V_{liv} = \frac{K_{liv}*f_{up}}{R_{b:p}}V_{liver}
V_{sc} = \frac{K_{sc}*f_{up}}{R_{b:p}}V_{rest}
where "pv" is the portal vein, "liv" is the liver, and "sc" is the systemiccompartment; V_gut, V_liver, and V_rest are physiological tissue volumes;K_x are chemical- and tissue-specific equilibrium partition coefficients between tissue and free chemical concentration in plasma;f_up is the chemical-specific fraction unbound in plasma; and R_b:p is the chemical specific ratio of concentrations in blood:plasma.The blood concentrations evolve according to:
\frac{d C_{pv}}{dt} = \frac{1}{V_{pv}}\left(k_{abs}A_{si} + Q_{pv}C_{sc}-Q_{pv}C_{pv}\right)
\frac{d C_{liv}}{dt} = \frac{1}{V_{liv}}\left(Q_{pv}C_{pv} + Q_{ha}C_{sc}-\left(Q_{pv} + Q{ha}\right)C_{liv}-\frac{1}{R_{b:p}}Cl_{h}C_{liv}\right)
\frac{d C_{sc}}{dt} = \frac{1}{V_{sc}}\left(\left(Q_{pv} + Q_{ha}\right)C_{liv} - \left(Q_{pv} + Q_{ha}\right)C_{sc} - \frac{f_{up}}{R_{b:p}}*Q_{GFR}*C_{sc}\right)
where "ha" is the hepatic artery, Q's are flows, "GFR" is the glomerularfiltration rate in the kidney, clearance (scaled up from intrinsic clearance, which does not depend on flow).Plasma concentration in compartment x is given byC_{x,plasma} = \frac{C_{x}}{R_{b2p}} for a tissue independent value ofR_{b2p}.
Usage
solve_3comp( chem.name = NULL, chem.cas = NULL, dtxsid = NULL, times = NULL, parameters = NULL, days = 10, tsteps = 4, daily.dose = NULL, dose = NULL, doses.per.day = NULL, initial.values = NULL, plots = FALSE, suppress.messages = FALSE, species = "Human", iv.dose = FALSE, input.units = "mg/kg", output.units = NULL, default.to.human = FALSE, class.exclude = TRUE, physchem.exclude = TRUE, recalc.blood2plasma = FALSE, recalc.clearance = FALSE, clint.pvalue.threshold = 0.05, dosing.matrix = NULL, adjusted.Funbound.plasma = TRUE, regression = TRUE, restrictive.clearance = TRUE, minimum.Funbound.plasma = 1e-04, Caco2.options = list(), monitor.vars = NULL, ...)Arguments
chem.name | Either the chemical name, CAS number, or the parametersmust be specified. |
chem.cas | Either the chemical name, CAS number, or the parameters mustbe specified. |
dtxsid | EPA's DSSTox Structure ID (https://comptox.epa.gov/dashboard)the chemical must be identified by either CAS, name, or DTXSIDs |
times | Optional time sequence for specified number of days. Thedosing sequence begins at the beginning of times. |
parameters | Chemical parameters from parameterize_3comp function,overrides chem.name and chem.cas. |
days | Length of the simulation. |
tsteps | The number time steps per hour. |
daily.dose | Total daily dose, mg/kg BW. |
dose | Amount of a single dose, mg/kg BW. |
doses.per.day | Number of doses per day. |
initial.values | Vector containing the initial concentrations oramounts of the chemical in specified tissues with units corresponding tooutput.units. Defaults are zero. |
plots | Plots all outputs if true. |
suppress.messages | Whether or not the output message is suppressed. |
species | Species desired (either "Rat", "Rabbit", "Dog", "Mouse", ordefault "Human"). |
iv.dose | Simulates a single i.v. dose if true. |
input.units | Input units of interest assigned to dosing,defaults to mg/kg BW |
output.units | A named vector of output units expected for the modelresults. Default, NULL, returns model results in units specified in the'modelinfo' file. See table below for details. |
default.to.human | Substitutes missing animal values with human valuesif true (hepatic intrinsic clearance or fraction of unbound plasma). |
class.exclude | Exclude chemical classes identified as outside of domain of applicability by relevant modelinfo_[MODEL] file (default TRUE). |
physchem.exclude | Exclude chemicals on the basis of physico-chemicalproperties (currently only Henry's law constant) as specified by the relevant modelinfo_[MODEL] file (default TRUE). |
recalc.blood2plasma | Recalculates the ratio of the amount of chemicalin the blood to plasma using the input parameters, calculated withhematocrit, Funbound.plasma, and Krbc2pu. |
recalc.clearance | Recalculates the the hepatic clearance(Clmetabolism) with new million.cells.per.gliver parameter. |
clint.pvalue.threshold | Hepatic clearances with clearance assayshaving p-values greater than the threshold are set to zero. |
dosing.matrix | Vector of dosing times or a matrix consisting of twocolumns or rows named "dose" and "time" containing the time and amount, inmg/kg BW, of each dose. |
adjusted.Funbound.plasma | Uses adjusted Funbound.plasma when set toTRUE along with partition coefficients calculated with this value. |
regression | Whether or not to use the regressions in calculatingpartition coefficients. |
restrictive.clearance | Protein binding not taken into account (set to1) in liver clearance if FALSE. |
minimum.Funbound.plasma | Monte Carlo draws less than this value are set equal to this value (default is 0.0001 – half the lowest measured Fup in ourdataset). |
Caco2.options | A list of options to use when working with Caco2 apical to basolateral data |
monitor.vars | Which variables are returned as a function of time. Defaults value of NULL provides "Cliver", "Csyscomp", "Atubules", "Ametabolized", "AUC" |
... | Additional arguments passed to the integrator (deSolve). |
Details
Note that the timescales for the model parameters have units of hours while the model output is in days.
Default of NULL for doses.per.day solves for a single dose.
The compartments used in this model are the gutlumen, gut, liver, andrest-of-body, with the plasma related to the concentration in the bloodin the systemic compartment by the blood:plasma ratio.
Model Figure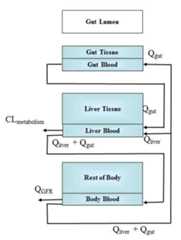
When species is specified as rabbit, dog, or mouse, the function uses theappropriate physiological data(volumes and flows) but substitutes humanfraction unbound, partition coefficients, and intrinsic hepatic clearance.
Because this model does not simulate exhalation, inhalation, and other processes relevant to volatile chemicals, this model is by default restricted to chemicals with a logHenry's Law Constant less than that of Acetone, a known volatile chemical. That is, chemicals with logHLC > -4.5 (Log10 atm-m3/mole) are excluded. Volatility is not purely determined by the Henry's Law Constant, therefore this chemical exclusion may be turned off with the argument "physchem.exclude = FALSE". Similarly, per- and polyfluoroalkyl substances (PFAS) are excluded by default because the transporters that often drive PFAS toxicokinetics are not included in this model. However, PFAS chemicals can be included with the argument "class.exclude = FALSE".
Value
A matrix of class deSolve with a column for time(in days) and eachcompartment, the plasma concentration, area under the curve, and a row foreach time point.
Author(s)
John Wambaugh and Robert Pearce
References
Pearce RG, Setzer RW, Strope CL, Wambaugh JF, Sipes NS (2017).“Httk: R package for high-throughput toxicokinetics.”Journal of Statistical Software,79(4), 1.doi:10.18637/jss.v079.i04.
See Also
Examples
solve_3comp(chem.name='Bisphenol-A', doses.per.day=2, daily.dose=.5, days=1, tsteps=2)# By storing the model parameters in a vector first, you can potentially# edit them before using the model:params <-parameterize_3comp(chem.cas="80-05-7")solve_3comp(parameters=params, days=1)head(solve_3comp(chem.name="Terbufos", daily.dose=NULL, dose=1, days=1))head(solve_3comp(chem.name="Terbufos", daily.dose=NULL, dose=1, days=1, iv.dose=TRUE))# A dose matrix specifies times and magnitudes of doses:dm <- matrix(c(0,1,2,5,5,5),nrow=3)colnames(dm) <- c("time","dose")solve_3comp(chem.name="Methenamine", dosing.matrix=dm, dose=NULL, daily.dose=NULL, days=2.5)solve_3comp(chem.name="Besonprodil", daily.dose=1, dose=NULL, days=2.5, doses.per.day=4)# The following will not work because Diquat dibromide monohydrate's # Henry's Law Constant (-3.912) is higher than that of Acetone (~-4.5):try(head(solve_3comp(chem.cas = "6385-62-2")))# However, we can turn off checking for phys-chem properties, since we know# that Diquat dibromide monohydrate is not too volatile:head(solve_3comp(chem.cas = "6385-62-2", physchem.exclude = FALSE))# Try different ways of calling the function:head(solve_3comp(chem.name="bisphenol a",days=1))head(solve_3comp(chem.cas="80-05-7",days=1))head(solve_3comp(parameters=parameterize_3comp(chem.cas="80-05-7"),days=1))Solve_3comp2
Description
This function solves for the amounts or concentrations of a chemical inthe blood of three different compartments representing the body.The volumes of the three compartments are chemical specific, determined fromthe true tissue volumes multiplied by the partition coefficients:
V_{pv} = V_{gut}
V_{liv} = \frac{K_{liv}*f_{up}}{R_{b:p}}V_{liver}
V_{sc} = \frac{K_{sc}*f_{up}}{R_{b:p}}V_{rest}
where "pv" is the portal vein, "liv" is the liver, and "sc" is the systemiccompartment; V_gut, V_liver, and V_rest are physiological tissue volumes;K_x are chemical- and tissue-specific equilibrium partition coefficients between tissue and free chemical concentration in plasma;f_up is the chemical-specific fraction unbound in plasma; and R_b:p is the chemical specific ratio of concentrations in blood:plasma.The blood concentrations evolve according to:
\frac{d C_{pv}}{dt} = \frac{1}{V_{pv}}\left(k_{abs}A_{si} + Q_{pv}C_{sc}-Q_{pv}C_{pv}\right)
\frac{d C_{liv}}{dt} = \frac{1}{V_{liv}}\left(Q_{pv}C_{pv} + Q_{ha}C_{sc}-\left(Q_{pv} + Q{ha}\right)C_{liv}-\frac{1}{R_{b:p}}Cl_{h}C_{liv}\right)
\frac{d C_{sc}}{dt} = \frac{1}{V_{sc}}\left(\left(Q_{pv} + Q_{ha}\right)C_{liv} - \left(Q_{pv} + Q_{ha}\right)C_{sc} - \frac{f_{up}}{R_{b:p}}*Q_{GFR}*C_{sc}\right)
where "ha" is the hepatic artery, Q's are flows, "GFR" is the glomerularfiltration rate in the kidney, clearance (scaled up from intrinsic clearance, which does not depend on flow).Plasma concentration in compartment x is given byC_{x,plasma} = \frac{C_{x}}{R_{b2p}} for a tissue independent value ofR_{b2p}.
Usage
solve_3comp2( chem.name = NULL, chem.cas = NULL, dtxsid = NULL, times = NULL, parameters = NULL, days = 10, tsteps = 4, daily.dose = NULL, dose = NULL, doses.per.day = NULL, initial.values = NULL, plots = FALSE, suppress.messages = FALSE, species = "Human", route = "oral", iv.dose = FALSE, input.units = "mg/kg", output.units = NULL, default.to.human = FALSE, physchem.exclude = TRUE, class.exclude = TRUE, recalc.blood2plasma = FALSE, recalc.clearance = FALSE, clint.pvalue.threshold = 0.05, dosing.matrix = NULL, adjusted.Funbound.plasma = TRUE, regression = TRUE, restrictive.clearance = TRUE, minimum.Funbound.plasma = 1e-04, Caco2.options = list(), monitor.vars = NULL, ...)Arguments
chem.name | Either the chemical name, CAS number, or the parametersmust be specified. |
chem.cas | Either the chemical name, CAS number, or the parameters mustbe specified. |
dtxsid | EPA's DSSTox Structure ID (https://comptox.epa.gov/dashboard)the chemical must be identified by either CAS, name, or DTXSIDs |
times | Optional time sequence for specified number of days. Thedosing sequence begins at the beginning of times. |
parameters | Chemical parameters from parameterize_3comp function,overrides chem.name and chem.cas. |
days | Length of the simulation. |
tsteps | The number time steps per hour. |
daily.dose | Total daily dose, mg/kg BW. |
dose | Amount of a single dose, mg/kg BW. |
doses.per.day | Number of doses per day. |
initial.values | Vector containing the initial concentrations oramounts of the chemical in specified tissues with units corresponding tooutput.units. Defaults are zero. |
plots | Plots all outputs if true. |
suppress.messages | Whether or not the output message is suppressed. |
species | Species desired (either "Rat", "Rabbit", "Dog", "Mouse", ordefault "Human"). |
route | Route of exposure ("inhalation", "intravenous" or [DEFAULT]"oral") passed to |
iv.dose | Simulates a single i.v. dose if true. |
input.units | Input units of interest assigned to dosing,defaults to mg/kg BW |
output.units | A named vector of output units expected for the modelresults. Default, NULL, returns model results in units specified in the'modelinfo' file. See table below for details. |
default.to.human | Substitutes missing animal values with human valuesif true (hepatic intrinsic clearance or fraction of unbound plasma). |
physchem.exclude | Exclude chemicals on the basis of physico-chemicalproperties (currently only Henry's law constant) as specified by the relevant modelinfo_[MODEL] file (default TRUE). |
class.exclude | Exclude chemical classes identified as outside of domain of applicability by relevant modelinfo_[MODEL] file (default TRUE). |
recalc.blood2plasma | Recalculates the ratio of the amount of chemicalin the blood to plasma using the input parameters, calculated withhematocrit, Funbound.plasma, and Krbc2pu. |
recalc.clearance | Recalculates the the hepatic clearance(Clmetabolism) with new million.cells.per.gliver parameter. |
clint.pvalue.threshold | Hepatic clearances with clearance assayshaving p-values greater than the threshold are set to zero. |
dosing.matrix | Vector of dosing times or a matrix consisting of twocolumns or rows named "dose" and "time" containing the time and amount, inmg/kg BW, of each dose. |
adjusted.Funbound.plasma | Uses adjusted Funbound.plasma when set toTRUE along with partition coefficients calculated with this value. |
regression | Whether or not to use the regressions in calculatingpartition coefficients. |
restrictive.clearance | Protein binding not taken into account (set to1) in liver clearance if FALSE. |
minimum.Funbound.plasma | Monte Carlo draws less than this value are set equal to this value (default is 0.0001 – half the lowest measured Fup in ourdataset). |
Caco2.options | A list of options to use when working with Caco2 apical to basolateral data |
monitor.vars | Which variables are returned as a function of time. Defaults value of NULL provides "Cliver", "Csyscomp", "Atubules", "Ametabolized", "AUC" |
... | Additional arguments passed to the integrator (deSolve). |
Details
Note that the timescales for the model parameters have units of hours while the model output is in days.
Default of NULL for doses.per.day solves for a single dose.
The compartments used in this model are the gutlumen, gut, liver, andrest-of-body, with the plasma related to the concentration in the bloodin the systemic compartment by the blood:plasma ratio.
Model Figure
When species is specified as rabbit, dog, or mouse, the function uses theappropriate physiological data(volumes and flows) but substitutes humanfraction unbound, partition coefficients, and intrinsic hepatic clearance.
Per- and polyfluoroalkyl substances (PFAS) are excluded by default because the transporters that often drive PFAS toxicokinetics are not included in this model. However, PFAS chemicals can be included with the argument "class.exclude = FALSE".
Value
A matrix of class deSolve with a column for time(in days) and eachcompartment, the plasma concentration, area under the curve, and a row foreach time point.
Author(s)
John Wambaugh and Robert Pearce
References
Wambaugh JF, Schacht CM, Ring CL (2025).“A Simple Physiologically Based Toxicokinetic Model for Multi-Route In Vitro–In Vivo Extrapolation.”Environmental Science & Technology Letters,12(3), 261–268.doi:10.1021/acs.estlett.4c00967.
See Also
Examples
solve_3comp2(dtxsid="DTXSID0020573",route="inhalation",dose=1,input.units="ppmv")Solve the3comp_lifestage model, which has time-dependent parameters
Description
This function solves for the amounts or concentrations of a chemical inthe blood of three different compartments representing the body.The volumes of the three compartments are chemical specific, determined fromthe true tissue volumes multiplied by the partition coefficients:
V_{pv} = V_{gut}
V_{liv} = \frac{K_{liv}*f_{up}}{R_{b:p}}V_{liver}
V_{sc} = \frac{K_{sc}*f_{up}}{R_{b:p}}V_{rest}
where "pv" is the portal vein, "liv" is the liver, and "sc" is the systemiccompartment; V_gut, V_liver, and V_rest are physiological tissue volumes;K_x are chemical- and tissue-specific equilibrium partition coefficients between tissue and free chemical concentration in plasma;f_up is the chemical-specific fraction unbound in plasma; and R_b:p is the chemical specific ratio of concentrations in blood:plasma.The blood concentrations evolve according to:
\frac{d C_{pv}}{dt} = \frac{1}{V_{pv}}\left(k_{abs}A_{si} + Q_{pv}C_{sc}-Q_{pv}C_{pv}\right)
\frac{d C_{liv}}{dt} = \frac{1}{V_{liv}}\left(Q_{pv}C_{pv} + Q_{ha}C_{sc}-\left(Q_{pv} + Q{ha}\right)C_{liv}-\frac{1}{R_{b:p}}Cl_{h}C_{liv}\right)
\frac{d C_{sc}}{dt} = \frac{1}{V_{sc}}\left(\left(Q_{pv} + Q_{ha}\right)C_{liv} - \left(Q_{pv} + Q_{ha}\right)C_{sc} - \frac{f_{up}}{R_{b:p}}*Q_{GFR}*C_{sc}\right)
where "ha" is the hepatic artery, Q's are flows, "GFR" is the glomerularfiltration rate in the kidney, clearance (scaled up from intrinsic clearance, which does not depend on flow).Plasma concentration in compartment x is given byC_{x,plasma} = \frac{C_{x}}{R_{b2p}} for a tissue independent value ofR_{b2p}.
Usage
solve_3comp_lifestage( chem.name = NULL, chem.cas = NULL, dtxsid = NULL, times = NULL, parameters = NULL, days = 10, tsteps = 4, daily.dose = NULL, dose = NULL, doses.per.day = NULL, initial.values = NULL, plots = FALSE, suppress.messages = FALSE, species = "Human", iv.dose = FALSE, input.units = "mg/kg", output.units = NULL, default.to.human = FALSE, recalc.blood2plasma = FALSE, recalc.clearance = FALSE, clint.pvalue.threshold = 0.05, dosing.matrix = NULL, adjusted.Funbound.plasma = TRUE, regression = TRUE, restrictive.clearance = TRUE, minimum.Funbound.plasma = 1e-04, Caco2.options = list(), monitor.vars = NULL, time.varying.params = TRUE, start.age = 360, ref.pop.dt = NULL, httkpop.generate.arg.list = list(method = "virtual individuals", nsamp = 25000), ref.params = NULL, ...)Arguments
chem.name | Either the chemical name, CAS number, or the parametersmust be specified. |
chem.cas | Either the chemical name, CAS number, or the parameters mustbe specified. |
dtxsid | EPA's DSSTox Structure ID (https://comptox.epa.gov/dashboard)the chemical must be identified by either CAS, name, or DTXSIDs |
times | Optional time sequence for specified number of days. Thedosing sequence begins at the beginning of times. |
parameters | Chemical parameters from parameterize_3comp function,overrides chem.name and chem.cas. |
days | Length of the simulation. |
tsteps | The number time steps per hour. |
daily.dose | Total daily dose, mg/kg BW. |
dose | Amount of a single dose, mg/kg BW. |
doses.per.day | Number of doses per day. |
initial.values | Vector containing the initial concentrations oramounts of the chemical in specified tissues with units corresponding tooutput.units. Defaults are zero. |
plots | Plots all outputs if true. |
suppress.messages | Whether or not the output message is suppressed. |
species | Species desired (either "Rat", "Rabbit", "Dog", "Mouse", ordefault "Human"). |
iv.dose | Simulates a single i.v. dose if true. |
input.units | Input units of interest assigned to dosing,defaults to mg/kg BW |
output.units | A named vector of output units expected for the modelresults. Default, NULL, returns model results in units specified in the'modelinfo' file. See table below for details. |
default.to.human | Substitutes missing animal values with human valuesif true (hepatic intrinsic clearance or fraction of unbound plasma). |
recalc.blood2plasma | Recalculates the ratio of the amount of chemicalin the blood to plasma using the input parameters, calculated withhematocrit, Funbound.plasma, and Krbc2pu. |
recalc.clearance | Recalculates the the hepatic clearance(Clmetabolism) with new million.cells.per.gliver parameter. |
clint.pvalue.threshold | Hepatic clearances with clearance assayshaving p-values greater than the threshold are set to zero. |
dosing.matrix | Vector of dosing times or a matrix consisting of twocolumns or rows named "dose" and "time" containing the time and amount, inmg/kg BW, of each dose. |
adjusted.Funbound.plasma | Uses adjusted Funbound.plasma when set toTRUE along with partition coefficients calculated with this value. |
regression | Whether or not to use the regressions in calculatingpartition coefficients. |
restrictive.clearance | Protein binding not taken into account (set to1) in liver clearance if FALSE. |
minimum.Funbound.plasma | Monte Carlo draws less than this value are set equal to this value (default is 0.0001 – half the lowest measured Fup in ourdataset). |
Caco2.options | A list of options to use when working with Caco2 apical tobasolateral data |
monitor.vars | Which variables are returned as a function of time. Defaults value of NULL provides "Cliver", "Csyscomp", "Atubules", "Ametabolized", "AUC" |
time.varying.params | Whether or not to allow parameters to vary in time according to the nonparametric regression determined by |
start.age | The age of the individual in months at the beginning of thesimulation. Default 360. |
ref.pop.dt | The output of |
httkpop.generate.arg.list | If |
ref.params | Model parameters of a reference population used in determiningtimeseries. Recommended column binding ages in months (as |
... | Additional arguments passed to the integrator (deSolve). |
Details
Note that the timescales for the model parameters have units of hours while the model output is in days.
Default of NULL for doses.per.day solves for a single dose.
The compartments used in this model are the gutlumen, gut, liver, andrest-of-body, with the plasma related to the concentration in the bloodin the systemic compartment by the blood:plasma ratio.
Model Figure
When species is specified as rabbit, dog, or mouse, the function uses theappropriate physiological data(volumes and flows) but substitutes humanfraction unbound, partition coefficients, and intrinsic hepatic clearance.
Value
A matrix of class deSolve with a column for time(in days) and eachcompartment, the plasma concentration, area under the curve, and a row foreach time point.
Author(s)
Colin Thomson
See Also
Examples
params <- parameterize_3comp(chem.name = 'Bisphenol A')pop.phys <- httkpop_generate(method = 'virtual individuals', nsamp = 25000, agelim_years = c(18, 79), weight_category = c("Normal"))pop.params <- create_mc_samples(chem.name = 'Bisphenol A', model = '3compartment', httkpop.dt = pop.phys)ref.params <- cbind(pop.params, age_months = pop.phys$age_months)out <- solve_3comp_lifestage(chem.name = 'Bisphenol A', parameters = params, days = 365, start.age = 600, # age fifty ref.params = ref.params, doses.per.day = 3, daily.dose = 1)Solve_dermal_PBTK
Description
This function solves for the amounts or concentrations in uM of a chemical indifferent tissues as functions of time after dermal exposure.
Usage
solve_dermal_pbtk( chem.name = NULL, chem.cas = NULL, dtxsid = NULL, model.type = "dermal_1subcomp", method.permeability = "UK-Surrey", Kvehicle2water = NULL, times = NULL, parameters = NULL, days = 10, tsteps = 4, plots = FALSE, monitor.vars = NULL, suppress.messages = F, species = "Human", method = NULL, rtol = 1e-06, atol = 1e-06, recalc.blood2plasma = FALSE, recalc.clearance = FALSE, adjusted.Funbound.plasma = TRUE, minimum.Funbound.plasma = 1e-04, parameterize.arg.list = list(default.to.human = FALSE, clint.pvalue.threshold = 0.05, restrictive.clearance = TRUE, regression = TRUE), route = NULL, Vvehicle = NULL, initial.dose = NULL, daily.dose = NULL, doses.per.day = NULL, input.units = NULL, dose.duration = NULL, dose.duration.units = NULL, dosing.dermal = NULL, dosing.matrix = NULL, washoff = FALSE, InfiniteDose = FALSE, period = 0, ...)Arguments
chem.name | Either the chemical name, CAS number, or the parametersmust be specified. |
chem.cas | Either the chemical name, CAS number, or the parameters mustbe specified. |
dtxsid | EPA's DSSTox Structure ID (https://comptox.epa.gov/dashboard)the chemical must be identified by either CAS, name, or DTXSIDs. |
model.type | Choice of dermal model, either the default "dermal_1subcomp" forthe model with 1 compartment for the skin; or "dermal" for the model with 2 sub compartments for skin: the stratum corneum (SC) and the combinedviable epidermis and dermis (ED). |
method.permeability | For "dermal_1subcomp" model, method of calculating the permeability coefficient, P, either "Potts-Guy" or "UK-Surrey". Defaultis "UK-Surrey" (Sawyer et al., 2016 and Chen et al., 2015), which uses Fick'slaw of diffusion to calculate P. For "dermal" model, this parameter is ignored. |
Kvehicle2water | Partition coefficient for the vehicle (sometimes called the media) carrying the chemical to water. Default is "water", which assumes the vehicle is water.Other optional inputs are "octanol" and "olive oil". |
times | Optional time sequence for specified number of days. Dosingsequence begins at the beginning of times. |
parameters | Chemical parameters from parameterize_dermal_pbtk function,overrides chem.name and chem.cas. |
days | Length of the simulation.If "times" input is used, this is ignored. |
tsteps | The number time steps per hour. |
plots | Plots all outputs if true. |
monitor.vars | Which variables are returned as a function of time. Default values of NULL looks up variables specified in modelinfo_MODEL.R |
suppress.messages | Whether or not the output message is suppressed. |
species | Species desired (either "Rat", "Rabbit", "Dog", "Mouse", ordefault "Human"). |
method | Method used by integrator ( |
rtol | Argument passed to integrator ( |
atol | Argument passed to integrator ( |
recalc.blood2plasma | Recalculates the ratio of the amount of chemicalin the blood to plasma using the input parameters, calculated withhematocrit, Funbound.plasma, and Krbc2pu. |
recalc.clearance | Recalculates the the hepatic clearance(Clmetabolism) with new million.cells.per.gliver parameter. |
adjusted.Funbound.plasma | Uses adjusted Funbound.plasma when set toTRUE along with partition coefficients calculated with this value. |
minimum.Funbound.plasma | Monte Carlo draws less than this value are set equal to this value (default is 0.0001 – half the lowest measured Fup in ourdataset). |
parameterize.arg.list | Additional parameterized passed to the model parameterization function, "parameterize_dermal_pbtk". The inputs "model.type","method.permeability", and "Kvehicle2water" are not passed through this. |
route | Route of exposure, can be "oral" OR "iv" OR "dermal" (default). |
Vvehicle | Volume of vehicle applied to skin in L, defaults to 0.1 L. If InfiniteDose=TRUE, this parameter is ignored and set = 1. |
initial.dose | Initial exposure dose. If InfiniteDose=TRUE, this is a concentration, otherwise, this is an amount. |
daily.dose | Total daily dose, defaults to mg/kg BW. |
doses.per.day | Number of doses per day. |
input.units | Exposure units applied to initial.dose and/or dosing.dermal.If InfiniteDose=TRUE, must be a concentration, e.g., "mg/kg/L" (default), otherwise,must be an amount, e.g., "mg/kg" (default). |
dose.duration | Amount of time dermal dose is on skin before being washed off.Note that when dose.duration is used, washoff=TRUE. |
dose.duration.units | Units for dose.duration, can be "minutes" OR "hours" OR "days" (default). |
dosing.dermal | Matrix consisting of three columns named"Cvehicle", "Vvehicle", and "time" containing the dosing times, days,with the applied amount in the vehicle, and the volume of the appliedvehicle, L. Note that the units of Cvehicle are controlled by input.units. **IfInfiniteDose=TRUE, the Vvehicle column of dosing.dermal is ignored.** |
dosing.matrix | Vector of dosing times or a matrix consisting of twocolumns or rows named "dose" and "time" containing the time and amount, inmg/kg BW, of each dose. |
washoff | If TRUE, any chemical left on the skin is assumed to be replaced by new dose (i.e., wash-off occurs before new dose is administered). If FALSE (default), any chemical left on the skin is added to the new dose. |
InfiniteDose | Is there so much compound in the vehicle that it does not deplete? |
period | How often the dosing repeats, specified in days |
... | Additional arguments passed to the integrator ( |
Details
The user can input dermal doses via one of three options:
- "dose.duration"
User can input the length of exposure time for one dermal dose before wash-off occurs. Note that initial.dose can be used to change the initial dose used along with this option.
- "dosing.dermal"
With this option, users can input multiple doses over time as a matrix with columns for time, the volume of vehicle administered, and the concentration of the vehicle administered. Note that the the parameter washoff can be used to specify whether chemical is washed off in between doses.
- "dosing.matrix"
This option is also used to describe multiple exposure doses over time, and is described in the help file of solve_model. Note that unlike dosing.dermal, Vvehicle cannot be changed with this option.
Model units are the same as vehicle concentration, units/L or units whenuse.amounts=TRUE.
New doses replace rather than add to previous doses. A concentration of 0 indosing.matrix switches off the dosing/diffusion between the vehicle andexposed skin.
Note that the model parameters have units of hours while the model output isin days.
The compartments used in this model are the gutlumen, gut, liver, kidneys,veins, arteries, lungs, unexposed skin, exposed skin, vehicle, and the rest of the body. When model.type = "dermal", a 2-compartment model is used where skinis divided into the stratum corneum, SC, and the combined viable epidermis anddermis, ED.
The extra compartments include the amounts or concentrations metabolized bythe liver and excreted by the kidneys through the tubules.
AUC is the area under the curve of the plasma concentration.
When species is specified as rabbit, dog, or mouse, the function uses theappropriate physiological data(volumes and flows) but substitutes humanfraction unbound, partition coefficients, and intrinsic hepatic clearance.
Value
A matrix of class deSolve with a column for time (in days), eachcompartment, the area under the curve, and plasma concentration and a rowfor each time point.
Author(s)
Annabel Meade, John Wambaugh, Celia Schacht, and Robert Pearce
Examples
# Dermal exposure to default doseout <- solve_dermal_pbtk(chem.name="bisphenola")# Dermal exposure to 20 mg/L in 0.01 L of octanol with wash-off after 8 hours# Since skin permeability happens quickly for bisphenol A, let's only look at 3 days.dose.conc <- 2 #mg/LVvehicle <- 0.01 #Linitial.dose <- dose.conc*Vvehicleout <- solve_dermal_pbtk(chem.name="bisphenola", initial.dose=initial.dose, input.units="mg", Vvehicle=0.01, Kskin2vehicle="octanol", dose.duration=8, dose.duration.units="hr", days=3)# Now, try this again with an infinite dose.out <- solve_dermal_pbtk(chem.name="bisphenola", initial.dose=dose.conc, input.units="mg/L", Vvehicle=0.01, Kskin2vehicle="octanol", dose.duration=8, dose.duration.units="hr", days=3, InfiniteDose=TRUE)# Now, try a scenario where 2 mg of chemical in 1 mL of water is applied # and washed off 8 hours later every day for 5 daysnum.days <- 5;time <- c(0:(num.days-1),(0:(num.days-1)) + 8/24); time <- sort(time) #in daysVvehicle <- rep(1e-3,length(time)) #convert mL to LCvehicle <- rep(c(2,0),num.days)/Vvehicle # convert 2 mg to mg/Ldosing.dermal <- cbind(time,Cvehicle,Vvehicle)out <- solve_dermal_pbtk(chem.name='bisphenola', dosing.dermal=dosing.dermal)parameters <- parameterize_dermal_pbtk(chem.name='bisphenola',skin_depth=1)parameters$Fskin_exposed <- 0.25parameters$Vvehicle <- 1out <- solve_dermal_pbtk(parameters=parameters)head(solve_dermal_pbtk(chem.name="propylparaben"))head(solve_dermal_pbtk(chem.cas="94-13-3"))p <- parameterize_dermal_pbtk(chem.name="propylparaben")p <- p[sort(names(p))]# Try to standardize order of variable namesfor (this.param in names(p)[order(toupper(names(p)))]) cat( paste(this.param,": ",p[[this.param]],"\r\n",sep=""))head(solve_dermal_pbtk(parameters=p)) # Dermal is the default route:head(solve_dermal_pbtk(chem.name="bisphenola"))head(solve_dermal_pbtk(chem.name="bisphenola", route="dermal"))# But we can also do intravenous (iv):head(solve_dermal_pbtk(chem.name="bisphenola", route="iv"))# And oral:head(solve_dermal_pbtk(chem.name="bisphenola", route="oral"))Solve_fetal_PBTK
Description
This function solves for the amounts or concentrations in uM of a chemicalin different tissues of a maternofetal system as functions of time based onthe dose and dosing frequency.
Usage
solve_fetal_pbtk( chem.name = NULL, chem.cas = NULL, dtxsid = NULL, times = seq(13 * 7, 40 * 7, 1), parameters = NULL, days = NULL, species = "human", tsteps = 1, dose = NULL, dosing.matrix = NULL, daily.dose = NULL, doses.per.day = NULL, initial.values = NULL, plots = FALSE, suppress.messages = FALSE, iv.dose = FALSE, input.units = "mg/kg", output.units = NULL, physchem.exclude = TRUE, class.exclude = TRUE, recalc.blood2plasma = FALSE, recalc.clearance = FALSE, adjusted.Funbound.plasma = TRUE, regression = TRUE, restrictive.clearance = TRUE, minimum.Funbound.plasma = 1e-04, monitor.vars = NULL, Caco2.options = list(), atol = 1e-06, rtol = 1e-06, ...)Arguments
chem.name | Either the chemical name, CAS number, or the parametersmust be specified. |
chem.cas | Either the chemical name, CAS number, or the parameters mustbe specified. |
dtxsid | EPA's DSSTox Structure ID (https://comptox.epa.gov/dashboard)the chemical must be identified by either CAS, name, or DTXSIDs |
times | Optional time sequence in days. Dosing sequence begins at thebeginning of times. Default is from 13th week of pregnancy to 40th due to data constraints. |
parameters | Chemical parameters from parameterize_fetal_pbtk function,overrides chem.name and chem.cas. |
days | Length of the simulation. |
species | Included for compatibility with other functions, but the modelwill not run for non-human species (default "Human"). |
tsteps | The number time steps per hour. Default of 4. |
dose | Amount of a single, initial oral dose in mg/kg BW. |
dosing.matrix | A matrix of either one column (or row) with a set ofdosing times or with two columns (or rows) correspondingly named "dose" and"time" containing the time and amount, in mg/kg BW, of each dose. |
daily.dose | Total daily dose, mg/kg BW. |
doses.per.day | Number of doses per day. |
initial.values | Vector containing the initial concentrations oramounts of the chemical in specified tissues with units corresponding tocompartment.units. Defaults are zero. |
plots | Plots all outputs if true. |
suppress.messages | Whether or not the output message is suppressed. |
iv.dose | Simulates a single i.v. dose if true. |
input.units | Input units of interest assigned to dosing, defaults tomg/kg BW |
output.units | A named vector of output units expected for the modelresults. Default, NULL, returns model results in units specified in the'modelinfo' file. See table below for details. |
physchem.exclude | Exclude chemicals on the basis of physico-chemicalproperties (currently only Henry's law constant) as specified by the relevant modelinfo_[MODEL] file (default TRUE). |
class.exclude | Exclude chemical classes identified as outside of domain of applicability by relevant modelinfo_[MODEL] file (default TRUE). |
recalc.blood2plasma | Recalculates the ratio of the amount of chemicalin the blood to plasma using the input parameters, calculated withhematocrit, Funbound.plasma, and Krbc2pu. |
recalc.clearance | Recalculates the the hepatic clearance(Clmetabolism) with new million.cells.per.gliver parameter. |
adjusted.Funbound.plasma | Uses adjusted Funbound.plasma when set toTRUE along with partition coefficients calculated with this value. |
regression | Whether or not to use the regressions in calculatingpartition coefficients. |
restrictive.clearance | Protein binding not taken into account (set to1) in liver clearance if FALSE. |
minimum.Funbound.plasma | Monte Carlo draws less than this value are set equal to this value (default is 0.0001 – half the lowest measured Fup in ourdataset). |
monitor.vars | Which variables to track by default |
Caco2.options | A list of options to use when working with Caco2 apical to basolateral data |
atol | Absolute tolerance used by integrator (deSolve) to determinenumerical precision– defaults to 1e-8. |
rtol | Relative tolerance used by integrator (deSolve) to determine numerical precision – defaults to 1e-8. |
... | Additional arguments passed to the integrator. |
Details
The stage of pregnancy simulated here begins by default at the 13th week dueto a relative lack of data to support parameterization prior, in line with the recommendations of Kapraun et al. 2019 ("Empirical models for anatomicaland physiological..."), and ends at the 40th week of pregnancy.
Note that the model parameters have units of hours while the model output isin days. Dose is in mg, not scaled for body weight.
Default NULL value for doses.per.day solves for a single dose.
The maternal compartments used in this model are the gut lumen, gut, liver, venous blood, arterial blood, lung, adipose tissue, kidney, thyroid, and rest of body. A placenta is modeled as a joint organ shared by motherand fetus, through which chemical exchange can occur with the fetus. Fetalcompartments include arterial blood, venous blood, kidney, thyroid, liver,lung, gut, brain, and rest of body.
The extra compartments include the amounts or concentrations metabolized bythe liver and excreted by the kidneys through the tubules.
AUC is the area under the curve of the plasma concentration.
This gestational model is only parameterized for humans.
Because this model does not simulate exhalation, inhalation, and other processes relevant to volatile chemicals, this model is by default restricted to chemicals with a logHenry's Law Constant less than that of Acetone, a known volatile chemical. That is, chemicals with logHLC > -4.5 (Log10 atm-m3/mole) are excluded. Volatility is not purely determined by the Henry's Law Constant, therefore this chemical exclusion may be turned off with the argument "physchem.exclude = FALSE". Similarly, per- and polyfluoroalkyl substances (PFAS) are excluded by default because the transporters that often drive PFAS toxicokinetics are not included in this model. However, PFAS chemicals can be included with the argument "class.exclude = FALSE".
Value
A matrix of class deSolve with a column for time(in days), eachcompartment, the area under the curve, and plasma concentration and a rowfor each time point.
Author(s)
John Wambaugh, Mark Sfeir, and Dustin Kapraun
References
Kapraun DF, Sfeir M, Pearce RG, Davidson-Fritz SE, Lumen A, Dallmann A, Judson RS, Wambaugh JF (2022).“Evaluation of a rapid, generic human gestational dose model.”Reproductive Toxicology,113, 172–188.doi:10.1016/j.reprotox.2022.09.004.
See Also
Examples
out = solve_fetal_pbtk(chem.name = 'bisphenol a', daily.dose = 1,doses.per.day = 3)# With adjustement to fraction unbound plasma for fetus:fetal_parms_fup_adjusted <- parameterize_fetal_pbtk(chem.name = "triclosan")head(solve_fetal_pbtk(parameters = fetal_parms_fup_adjusted)) # Without adjustement to fraction unbound plasma for fetus:fetal_parms_fup_unadjusted <- parameterize_fetal_pbtk(chem.name = "triclosan", fetal_fup_adjustment = FALSE)head(solve_fetal_pbtk(parameters = fetal_parms_fup_unadjusted))# The following will not work because Diquat dibromide monohydrate's # Henry's Law Constant (-3.912) is higher than that of Acetone (~-4.5):try(head(solve_fetal_pbtk(chem.cas = "6385-62-2")))# However, we can turn off checking for phys-chem properties, since we know# that Diquat dibromide monohydrate is not too volatile:head(solve_fetal_pbtk(chem.cas = "6385-62-2", physchem.exclude = FALSE))# Try different ways to call the function:head(solve_fetal_pbtk(chem.cas="80-05-7"))head(solve_fetal_pbtk(parameters=parameterize_fetal_pbtk(chem.cas="80-05-7")))Solve_full_pregnancy
Description
This function solves for the amounts (in umol) or concentrations (in uM) of a chemical in different tissues of a maternal-fetal system over the full course of human pregnancy given a dose and dosing frequency.
Usage
solve_full_pregnancy( chem.name = NULL, chem.cas = NULL, dtxsid = NULL, time.course = seq(0, 40 * 7, 1), dose = NULL, daily.dose = NULL, doses.per.day = NULL, class.exclude = TRUE, physchem.exclude = TRUE, track.vars = NULL, plt = FALSE)Arguments
chem.name | Either the chemical name, CAS number, or DTXSIDmust be specified. |
chem.cas | Either the chemical name, CAS number, or DTXSID must be specified. |
dtxsid | EPA's DSSTox Structure ID (https://comptox.epa.gov/dashboard) |
time.course | Time sequence in days. Default is from 0th week of pregnancy to 40th, incremented by day. |
dose | Amount of a single, initial dose (on day 0) in mg/kg BW. |
daily.dose | Total daily dose, mg/kg BW for 40 weeks. |
doses.per.day | Number of doses per day for 40 weeks. |
class.exclude | Exclude chemical classes identified as outside of domain of applicability for fetal_pbtk and 1tri_pbtk models (i.e. PFAS chemicals). |
physchem.exclude | Exclude chemicals on the basis of physico-chemicalproperties (currently only Henry's law constant) as specified by the modelinfofiles for fetal_pbtk and 1tri_pbtk. |
track.vars | which variables to return in solution output dataframe |
plt | plots all outputs, if TRUE |
Details
The simulation starts at the 0th week and ends at 40 weeks of pregnancy (term), covering all trimesters of human pregnancy. This is accomplished by stitching together the 1tri and fetal PBTK models with appropriate initial conditions, as described in Truong et al. (TBD).
Value
A matrix with columns for time (in days), each compartment, the area under the curve (for plasma vs time), and plasma, and a row for each time point.
Author(s)
Kimberly Truong
References
Kapraun DF, Sfeir M, Pearce RG, Davidson-Fritz SE, Lumen A, Dallmann A, Judson RS, Wambaugh JF (2022).“Evaluation of a rapid, generic human gestational dose model.”Reproductive Toxicology,113, 172–188.doi:10.1016/j.reprotox.2022.09.004.
Truong KT, Wambaugh JF, Kapraun DF, Davidson-Fritz SE, Eytcheson S, Judson RS, Paul Friedman K (2025).“Interpretation of thyroid-relevant bioactivity data for comparison to in vivo exposures: A prioritization approach for putative chemical inhibitors of in vitro deiodinase activity.”Toxicology.doi:10.1016/j.tox.2025.154157.
See Also
Examples
library(httk)# dosing schedule of 1 mg/kg BW/day for 40 weeks# return solution by hourout <- solve_full_pregnancy(chem.name = "fipronil", daily.dose = 1, doses.per.day = 1, time.course = seq(0, 40*7, 1/24)) # return solution in chemical amounts for fetal compartments + placentamaternal_compts <- c('gutlumen', 'gut', 'liver', 'kidney', 'lung', 'ven', 'art', 'adipose','thyroid', 'rest')fetal_compts <- c(maternal_compts[! maternal_compts %in% c('adipose', 'gutlumen') ], "brain")amt.out <- solve_full_pregnancy(chem.name = "fipronil", daily.dose = 1, doses.per.day = 1, time.course = seq(0, 40*7, 1), track.vars = c(paste0("Af", fetal_compts), "Aplacenta"))# return solution in concentrations for fetal compartments + placenta conc.out <- solve_full_pregnancy(chem.name = "fipronil", daily.dose = 1, doses.per.day = 1, time.course = seq(0, 40*7, 1), track.vars = c(paste0("Cf", fetal_compts), "Cplacenta"))solve_gas_pbtk
Description
This function solves for the amounts or concentrations of a chemicalin different tissues as functions of time as a result of inhalation exposure to an ideal gas.In this PBTK formulation.C_{tissue} is the concentration in tissue at time t. Since the perfusion limited partition coefficients describe instantaneous equilibrium between the tissue and the free fraction in plasma, the whole plasma concentration isC_{tissue,plasma} = \frac{1}{f_{up}*K_{tissue2fup}}*C_{tissue}. Note that we use a single, constant value off_{up} across all tissues. Correspondingly the free plasma concentration is modeled asC_{tissue,free plasma} = \frac{1}{K_{tissue2fup}}*C_tissue. The amount of blood flowing from tissue x isQ_{tissue} (L/h) at a concentrationC_{x,blood} = \frac{R_{b2p}}{f_{up}*K_{tissue2fup}}*C_{tissue}, where we use a singleR_{b2p} value throughout the body.Metabolic clearance is modeled as being from the total plasma concentration here, though it is restricted to the free fraction incalc_hep_clearance by default. Renal clearance via glomerulsr filtration is from the free plasma concentration.
Usage
solve_gas_pbtk( chem.name = NULL, chem.cas = NULL, dtxsid = NULL, parameters = NULL, times = NULL, days = 10, tsteps = 4, daily.dose = NULL, doses.per.day = NULL, dose = NULL, dosing.matrix = NULL, forcings = NULL, exp.start.time = 0, exp.conc = 1, period = 24, exp.duration = 12, initial.values = NULL, plots = FALSE, suppress.messages = FALSE, species = "Human", iv.dose = FALSE, input.units = "ppmv", output.units = NULL, default.to.human = FALSE, class.exclude = TRUE, physchem.exclude = TRUE, recalc.blood2plasma = FALSE, recalc.clearance = FALSE, adjusted.Funbound.plasma = TRUE, regression = TRUE, restrictive.clearance = FALSE, minimum.Funbound.plasma = 1e-04, monitor.vars = NULL, vmax = 0, km = 1, exercise = FALSE, fR = 12, VT = 0.75, VD = 0.15, Caco2.options = list(), ...)Arguments
chem.name | Either the chemical name, CAS number, or the parametersmust be specified. |
chem.cas | Either the chemical name, CAS number, or the parameters mustbe specified. |
dtxsid | EPA's DSSTox Structure ID (https://comptox.epa.gov/dashboard)the chemical must be identified by either CAS, name, or DTXSIDs |
parameters | Chemical parameters from parameterize_gas_pbtk (or otherbespoke) function, overrides chem.name and chem.cas. |
times | Optional time sequence for specified number of days. Dosingsequence begins at the beginning of times. |
days | Length of the simulation. |
tsteps | The number of time steps per hour. |
daily.dose | Total daily dose |
doses.per.day | Number of doses per day. |
dose | Amount of a single dose |
dosing.matrix | Vector of dosing times or a matrix consisting of twocolumns or rows named "dose" and "time" containing the time and amount of each dose. |
forcings | Manual input of 'forcings' data series argument for odeintegrator. If left unspecified, 'forcings' defaults to NULL, and then other input parameters (see exp.start.time, exp.conc, exp.duration, and period)provide the necessary information to assemble a forcings data series. |
exp.start.time | Start time in specifying forcing exposure series,default 0. |
exp.conc | Specified inhalation exposure concentration for use in assembling "forcings" data series argument for integrator. Defaults tounits of ppmv. |
period | How often the dosing repeats, specified in days |
exp.duration | For use in assembling forcing function data series 'forcings' argument, specified in hours |
initial.values | Vector containing the initial concentrations oramounts of the chemical in specified tissues with units corresponding tothose specified for the model outputs. Default values are zero. |
plots | Plots all outputs if true. |
suppress.messages | Whether or not the output message is suppressed. |
species | Species desired (either "Rat", "Rabbit", "Dog", "Mouse", ordefault "Human"). |
iv.dose | Simulates a single i.v. dose if true. |
input.units | Input units of interest assigned to dosing, including forcings. Defaults to "ppmv" as applied to the default forcings scheme. |
output.units | A named vector of output units expected for the modelresults. Default, NULL, returns model results in units specified in the'modelinfo' file. See table below for details. |
default.to.human | Substitutes missing animal values with human valuesif true (hepatic intrinsic clearance or fraction of unbound plasma). |
class.exclude | Exclude chemical classes identified as outside of domain of applicability by relevant modelinfo_[MODEL] file (default TRUE). |
physchem.exclude | Exclude chemicals on the basis of physico-chemicalproperties (currently only Henry's law constant) as specified by the relevant modelinfo_[MODEL] file (default TRUE). |
recalc.blood2plasma | Recalculates the ratio of the amount of chemicalin the blood to plasma using the input parameters, calculated withhematocrit, Funbound.plasma, and Krbc2pu. |
recalc.clearance | Recalculates the hepatic clearance(Clmetabolism) with new million.cells.per.gliver parameter. |
adjusted.Funbound.plasma | Uses adjusted Funbound.plasma when set toTRUE along with partition coefficients calculated with this value. |
regression | Whether or not to use the regressions in calculatingpartition coefficients. |
restrictive.clearance | Protein binding not taken into account (set to1) in liver clearance if FALSE. (Default is FALSE.) |
minimum.Funbound.plasma | Monte Carlo draws less than this value are set equal to this value (default is 0.0001 – half the lowest measured Fup in ourdataset). |
monitor.vars | Which variables are returned as a function of time. Defaults value of NULL provides "Cgut", "Cliver", "Cven", "Clung", "Cart","Crest", "Ckidney", "Cplasma", "Calv", "Cendexh", "Cmixexh", "Cmuc", "Atubules", "Ametabolized", "AUC" |
vmax | Michaelis-Menten vmax value in reactions/min |
km | Michaelis-Menten concentration of half-maximal reaction velocityin desired output concentration units. |
exercise | Logical indicator of whether to simulate an exercise-inducedheightened respiration rate |
fR | Respiratory frequency (breaths/minute), used especially to adjustbreathing rate in the case of exercise. This parameter, along with VT and VD(below) gives another option for calculating Qalv (Alveolar ventilation) in case pulmonary ventilation rate is not known |
VT | Tidal volume (L), to be modulated especially as part of simulatingthe state of exercise |
VD | Anatomical dead space (L), to be modulated especially as part ofsimulating the state of exercise |
Caco2.options | A list of options to use when working with Caco2 apical to basolateral data |
... | Additional arguments passed to the integrator (deSolve).(Note: There are precision differences between M1 Mac and other OS systemsfor this function due to how long doubles are handled. To replicate resultsbetween various OS systems we suggest changing the default method of "lsoda"to "lsode" and also adding the argument mf = 10.See [deSolve::ode()] for further details.) |
Details
The default dosing scheme involves a specification of the start timeof exposure (exp.start.time), the concentration of gas inhaled (exp.conc),the period of a cycle of exposure and non-exposure (period), theduration of the exposure during that period (exp.duration), and the totaldays simulated. Together,these arguments determine the "forcings" passed tothe ODE integrator. Forcings can also be specified manually, or effectivelyturned off by setting exposure concentration to zero, if the user prefers to simulate dosing by other means.
The "forcings" object is configured to be passed to the integrator with,at the most, a basic unit conversion among ppmv, mg/L, and uM. No scaling byBW is set to be performed on the forcings series.
Note that the model parameters have units of hours while the model output isin days.
Default NULL value for doses.per.day solves for a single dose.
The compartments used in this model are the gut lumen, gut, liver, kidneys,veins, arteries, lungs, and the rest of the body.
The extra compartments include the amounts or concentrations metabolized bythe liver and excreted by the kidneys through the tubules.
AUC is the area under the curve of the plasma concentration.
Model Figure from (Linakis et al. 2020):
Model parameters are named according to the following convention:
| prefix | suffix | Meaning | units |
| K | Partition coefficient for tissue to free plasma | unitless | |
| V | Volume | L | |
| Q | Flow | L/h | |
| k | Rate | 1/h | |
| c | Parameter is proportional to body weight | 1 / kg for volumesand 1/kg^(3/4) for flows |
When species is specified but chemical-specific in vitro data are notavailable, the function uses the appropriate physiological data (volumes and flows) but default.to.human = TRUE must be used to substitute humanfraction unbound, partition coefficients, and intrinsic hepatic clearance.
Per- and polyfluoroalkyl substances (PFAS) are excluded by default because the transporters that often drive PFAS toxicokinetics are not included in this model. However, PFAS chemicals can be included with the argument "class.exclude = FALSE".
Value
A matrix of class deSolve with a column for time(in days), eachcompartment, the area under the curve, and plasma concentration and a rowfor each time point.
Author(s)
Matt Linakis, John Wambaugh, Mark Sfeir, Miyuki Breen
References
Linakis MW, Sayre RR, Pearce RG, Sfeir MA, Sipes NS, Pangburn HA, Gearhart JM, Wambaugh JF (2020).“Development and evaluation of a high-throughput inhalation model for organic chemicals.”Journal of exposure science & environmental epidemiology,30(5), 866–877.doi:10.1038/s41370-020-0238-y.
See Also
Examples
solve_gas_pbtk(chem.name = 'pyrene', exp.conc = 1, period = 24, expduration = 24)out <- solve_gas_pbtk(chem.name='pyrene', exp.conc = 0, doses.per.day = 2, daily.dose = 3, input.units = "umol", days=2.5, plots=TRUE, initial.values=c(Aven=20))out <- solve_gas_pbtk(chem.name = 'pyrene', exp.conc = 3, period = 24, days=2.5, exp.duration = 6, exercise = TRUE) params <- parameterize_gas_pbtk(chem.cas="80-05-7")solve_gas_pbtk(parameters=params, days=2.5)# Oral dose with exhalation as a route of elimination:out <- solve_gas_pbtk(chem.name = 'bisphenol a', exp.conc = 0, dose=100, days=2.5, input.units="mg/kg")# Note that different model compartments for this model have different units # and that the final units can be controlled with the output.units argument:head(solve_gas_pbtk(chem.name="lindane", days=2.5))# Convert all compartment units to mg/L:head(solve_gas_pbtk(chem.name="lindane", days=2.5, output.units="mg/L"))# Convert just the plasma to mg/L:head(solve_gas_pbtk(chem.name="lindane", days=2.5, output.units=list(Cplasma="mg/L")))signif(head(solve_gas_pbtk(chem.cas="129-00-0",times=c(0,0.1,0.05), method = "lsode",mf = 10)),2)signif(head(solve_gas_pbtk( parameters=parameterize_gas_pbtk(chem.cas="129-00-0"), times=c(0,0.1,0.05), method = "lsode",mf = 10)),2)Solve_model
Description
solve_model is designed to accept systematized metadata (provided by themodel.list defined in the modelinfo files) for a given toxicokinetic model, including names of variables, parameterizationfunctions, and key units, and use it along with chemical informationto prepare an ode system for numerical solution over time of the amountsor concentrations of chemical in different bodily compartments of a givenspecies (either "Rat", "Rabbit", "Dog", "Mouse", or default "Human").
Usage
solve_model( chem.name = NULL, chem.cas = NULL, dtxsid = NULL, times = NULL, parameters = NULL, model = NULL, route = "oral", dosing = NULL, days = 10, tsteps = 4, initial.values = NULL, initial.value.units = NULL, plots = FALSE, monitor.vars = NULL, suppress.messages = FALSE, species = "Human", input.units = "mg/kg", output.units = NULL, method = NULL, rtol = 1e-06, atol = 1e-06, hmin = 1e-08, recalc.blood2plasma = FALSE, recalc.clearance = FALSE, parameterize.args.list = list(), small.time = 1e-04, forcings = NULL, ...)Arguments
chem.name | Either the chemical name, CAS number, or the parametersmust be specified. |
chem.cas | Either the chemical name, CAS number, or the parameters mustbe specified. |
dtxsid | EPA's DSSTox Structure ID (https://comptox.epa.gov/dashboard)the chemical must be identified by either CAS, name, or DTXSIDs |
times | Optional time sequence for specified number of output times (in days) to be returned by the function.The model is solved explicitly at the time sequence specified. Dosing sequence begins at the first time provided. |
parameters | List of chemical parameters, as output by parameterize_pbtk function. Overrides chem.name and chem.cas. |
model | Specified model to use in simulation: "pbtk", "3compartment","3compartmentss", "1compartment", "schmitt", ... |
route | String specification of route of exposure for simulation:"oral", "iv", "inhalation", ... |
dosing | List of dosing metrics used in simulation, which includesthe namesake entries of a model's associated dosing.params. In the caseof most httk models, these should include "initial.dose", "doses.per.day", "daily.dose", and "dosing.matrix". The "dosing.matrix" is used for moreprecise dose regimen specification, and is a matrix consisting of twocolumns or rows named "time" and "dose" containing the time and amount of each dose. If none of the namesake entries of the dosing list is set to anon-NULL value, solve_model uses a default initial dose of 1 mg/kg BW along with the dose type (add/multiply) specified for a given route (for example, add the dose to gutlumen for oral route) |
days | Simulated period. Default 10 days. |
tsteps | The number of time steps per hour. Default of 4. |
initial.values | Vector of numeric values containing the initialconcentrations or amounts of the chemical in specified tissues with unitscorresponding to those specified for the model outputs. Default values are zero. |
initial.value.units | Vector of character strings containing the unitscorresponding to 'initial.values' specified for the model outputs.Default is assuming the units match expected compartment units for the model. |
plots | Plots all outputs if true. |
monitor.vars | Which variables are returned as a function of time. Default values of NULL looks up variables specified in modelinfo_MODEL.R |
suppress.messages | Whether or not the output messages are suppressed. |
species | Species desired (models have been designed to beparameterized for some subset of the following species: "Rat", "Rabbit", "Dog", "Mouse", or default "Human"). |
input.units | Input units of interest assigned to dosing. Defaultsto mg/kg BW, in line with the default dosing scheme of a one-time dose of1 mg/kg in which no other dosing parameters are specified. |
output.units | Output units of interest for the compiled components.Defaults to NULL, and will provide values in model units if unspecified. |
method | Method used by integrator ( |
rtol | Relative tolerance used by integrator ( |
atol | Absolute tolerance used by integrator ( |
hmin | minimum value of the integration stepsize ( |
recalc.blood2plasma | Recalculates the ratio of the amount of chemicalin the blood to plasma using the input parameters, calculated withhematocrit, Funbound.plasma, and Krbc2pu. |
recalc.clearance | Recalculates the the hepatic clearance(Clmetabolism) with new million.cells.per.gliver parameter. |
parameterize.args.list | Additional parameters passed to the modelparameterization function (other than chemical identifier, 'species','suppress.messages', 'restrictive.clearance', 'adjusted.Funbound.plasma',and 'minimum.Funbound.plasma') |
small.time | A tiny amount of time used to provide predictions on eitherside of an instantaneous event (like an iv injection). This helps ensure thatabrupt changes plot well. Defaults to 1e-4. |
forcings | A way of passing time-dependent quantities to the ODE solver.Should take the form of a list of two-column matrices with the first columncontaining time values and the second column the value of quantity at thosetimes. Default NULL. |
... | Additional arguments passed to the integrator. |
Details
Dosing values with certain acceptable associated input.units (like mg/kg BW)are configured to undergo a unit conversion. All model simulations are intended to run with units as specified by "compartment.units" in the model.list (as defined by the modelinfo files).
The 'dosing' argument includes all parameters needed to describe exposurein terms of route of administration, frequency, and quantity short of scenarios that require use of a more precise forcing function. If the dosingargument's namesake entries are left NULL, solve_model defaults to asingle-time dose of 1 mg/kg BW according to the given dosing route and associated type (either add/multiply, for example we typically add a dose to gut lumen when oral route is specified).
AUC is the area under the curve of the plasma concentration.
Model parameters are named according to the following convention:
| prefix | suffix | Meaning | units |
| K | Partition coefficient for tissue to free plasma | unitless | |
| V | Volume | L | |
| Q | Flow | L/h | |
| k | Rate | 1/h | |
| c | Parameter is proportional to body weight | 1 / kg for volumesand 1/kg^(3/4) for flows |
When species is specified but chemical-specific in vitro data are notavailable, the function uses the appropriate physiological data (volumes andflows) but default.to.human = TRUE must be used to substitute humanfraction unbound, partition coefficients, and intrinsic hepatic clearance.(NOTE: The 'default.to.human' specification should be included as part of thearguments listed in 'parameterize.args.list'.)
For both plotting purposes and helping the numerical equation solver, it ishelpful to specify that time points shortly before and after dosing are included. This function automatically add these points, and they are returnedto the user unless the times argument is used, in which case only the timepoints specified by that argument are provided.
Value
A matrix of class deSolve with a column for time(in days), eachcompartment, the area under the curve, and plasma concentration and a rowfor each time point.
Author(s)
John Wambaugh, Robert Pearce, Miyuki Breen, Mark Sfeir, andSarah E. Davidson
References
Pearce RG, Setzer RW, Strope CL, Wambaugh JF, Sipes NS (2017).“Httk: R package for high-throughput toxicokinetics.”Journal of Statistical Software,79(4), 1.doi:10.18637/jss.v079.i04.Davidson-Fritz SE, Ring CL, Evans MV, Schacht CM, Chang X, Breen M, Honda GS, Kenyon E, Linakis MW, Meade A, others (2025).“Enabling Transparent Toxicokinetic Modeling for Public Health Risk Assessment.”PLOS ONE,20(4), 1-40.doi:10.1371/journal.pone.0321321.
Examples
# The various "solve_x" functions are wrappers for solve_model:head(solve_pbtk(chem.name="Terbufos", days=1))head(solve_model(chem.name="Terbufos",model="pbtk", days=1, dosing=list( initial.dose = 1, # Assume dose is in mg/kg BW/day doses.per.day=NULL, dosing.matrix = NULL, daily.dose = NULL)))# A dose matrix specifies times and magnitudes of doses:dm <- matrix(c(0,1,2,5,5,5),nrow=3)colnames(dm) <- c("time","dose")solve_pbtk(chem.name="Methenamine", dosing.matrix=dm, dose=NULL, days=2.5, daily.dose=NULL)solve_model(chem.name="Methenamine", model="pbtk", days=2.5, dosing=list( initial.dose =NULL, doses.per.day=NULL, daily.dose=NULL, dosing.matrix=dm))solve_model(chem.name="Besonprodil", model="pbtk", days=2.5, dosing=list( initial.dose=NULL, doses.per.day=4, daily.dose=1, dosing.matrix=NULL)) solve_pbtk(chem.name="Besonprodil", daily.dose=1, dose=NULL, doses.per.day=4, days=2.5)Solve_PBTK
Description
This function solves for the amounts or concentrations in uM of a chemicalin different tissues as functions of time based on the dose and dosingfrequency. In this PBTK formulation.C_{tissue} is the concentration in tissue at time t. Since the perfusion limited partition coefficients describe instantaneous equilibrium between the tissue and the free fraction in plasma, the whole plasma concentration isC_{tissue,plasma} = \frac{1}{f_{up}*K_{tissue2fup}}*C_{tissue}. Note that we use a single, constant value off_{up} across all tissues. Correspondingly the free plasma concentration is modeled asC_{tissue,free plasma} = \frac{1}{K_{tissue2fup}}*C_tissue. The amount of blood flowing from tissue x isQ_{tissue} (L/h) at a concentrationC_{x,blood} = \frac{R_{b2p}}{f_{up}*K_{tissue2fup}}*C_{tissue}, where we use a singleR_{b2p} value throughout the body.Metabolic clearance is modeled as being from the total plasma concentration here, though it is restricted to the free fraction incalc_hep_clearance by default. Renal clearance via glomerular filtration is from the free plasma concentration.The compartments used in this model are the gutlumen, gut, liver, kidneys,veins, arteries, lungs, and the rest of the body.The extra compartments include the amounts or concentrations metabolized bythe liver and excreted by the kidneys through the tubules.AUC is the area under the curve of the plasma concentration.
Usage
solve_pbtk( chem.name = NULL, chem.cas = NULL, dtxsid = NULL, times = NULL, parameters = NULL, days = 10, tsteps = 4, daily.dose = NULL, dose = NULL, doses.per.day = NULL, initial.values = NULL, plots = FALSE, suppress.messages = FALSE, species = "Human", iv.dose = FALSE, input.units = "mg/kg", output.units = NULL, default.to.human = FALSE, class.exclude = TRUE, physchem.exclude = TRUE, recalc.blood2plasma = FALSE, recalc.clearance = FALSE, dosing.matrix = NULL, adjusted.Funbound.plasma = TRUE, regression = TRUE, restrictive.clearance = TRUE, minimum.Funbound.plasma = 1e-04, Caco2.options = list(), monitor.vars = NULL, ...)Arguments
chem.name | Either the chemical name, CAS number, or the parametersmust be specified. |
chem.cas | Either the chemical name, CAS number, or the parameters mustbe specified. |
dtxsid | EPA's DSSTox Structure ID (https://comptox.epa.gov/dashboard)the chemical must be identified by either CAS, name, or DTXSIDs |
times | Optional time sequence for specified number of days. Dosingsequence begins at the beginning of times. |
parameters | Chemical parameters from parameterize_pbtk function,overrides chem.name and chem.cas. |
days | Length of the simulation. |
tsteps | The number of time steps per hour. |
daily.dose | Total daily dose, defaults to mg/kg BW. |
dose | Amount of a single, initial oral dose in mg/kg BW. |
doses.per.day | Number of doses per day. |
initial.values | Vector containing the initial concentrations oramounts of the chemical in specified tissues with units corresponding tooutput.units. Defaults are zero. |
plots | Plots all outputs if true. |
suppress.messages | Whether or not the output message is suppressed. |
species | Species desired (either "Rat", "Rabbit", "Dog", "Mouse", ordefault "Human"). |
iv.dose | Simulates a single i.v. dose if true. |
input.units | Input units of interest assigned to dosing, defaults tomg/kg BW |
output.units | A named vector of output units expected for the modelresults. Default, NULL, returns model results in units specified in the'modelinfo' file. See table below for details. |
default.to.human | Substitutes missing animal values with human valuesif true (hepatic intrinsic clearance or fraction of unbound plasma). |
class.exclude | Exclude chemical classes identified as outside of domain of applicability by relevant modelinfo_[MODEL] file (default TRUE). |
physchem.exclude | Exclude chemicals on the basis of physico-chemicalproperties (currently only Henry's law constant) as specified by the relevant modelinfo_[MODEL] file (default TRUE). |
recalc.blood2plasma | Recalculates the ratio of the amount of chemicalin the blood to plasma using the input parameters, calculated withhematocrit, Funbound.plasma, and Krbc2pu. |
recalc.clearance | Recalculates the the hepatic clearance(Clmetabolism) with new million.cells.per.gliver parameter. |
dosing.matrix | Vector of dosing times or a matrix consisting of twocolumns or rows named "dose" and "time" containing the time and amount, inmg/kg BW, of each dose. |
adjusted.Funbound.plasma | Uses adjusted Funbound.plasma when set toTRUE along with partition coefficients calculated with this value. |
regression | Whether or not to use the regressions in calculatingpartition coefficients. |
restrictive.clearance | Protein binding not taken into account (set to1) in liver clearance if FALSE. |
minimum.Funbound.plasma | Monte Carlo draws less than this value are set equal to this value (default is 0.0001 – half the lowest measured Fup in ourdataset). |
Caco2.options | A list of options to use when working with Caco2 apical to basolateral data |
monitor.vars | Which variables are returned as a function of time. The default value of NULL provides "Cgut", "Cliver", "Cven", "Clung", "Cart", "Crest", "Ckidney", "Cplasma", "Atubules", "Ametabolized", and "AUC" |
... | Additional arguments passed to the integrator ( |
Details
Note that the model parameters have units of hours while the model output isin days.
Default NULL value for doses.per.day solves for a single dose.
Model Figure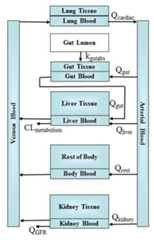
When species is specified as rabbit, dog, or mouse, the function uses theappropriate physiological data(volumes and flows) but substitutes humanfraction unbound, partition coefficients, and intrinsic hepatic clearance.
Because this model does not simulate exhalation, inhalation, and other processes relevant to volatile chemicals, this model is by default restricted to chemicals with a logHenry's Law Constant less than that of Acetone, a known volatile chemical. That is, chemicals with logHLC > -4.5 (Log10 atm-m3/mole) are excluded. Volatility is not purely determined by the Henry's Law Constant, therefore this chemical exclusion may be turned off with the argument "physchem.exclude = FALSE". Similarly, per- and polyfluoroalkyl substances (PFAS) are excluded by default because the transporters that often drive PFAS toxicokinetics are not included in this model. However, PFAS chemicals can be included with the argument "class.exclude = FALSE".
Value
A matrix of class deSolve with a column for time(in days), eachcompartment, the area under the curve, and plasma concentration and a rowfor each time point.
Author(s)
John Wambaugh and Robert Pearce
References
Pearce RG, Setzer RW, Strope CL, Wambaugh JF, Sipes NS (2017).“Httk: R package for high-throughput toxicokinetics.”Journal of Statistical Software,79(4), 1.doi:10.18637/jss.v079.i04.
See Also
Examples
# Multiple doses per day:head(solve_pbtk( chem.name='Bisphenol-A', daily.dose=.5, days=2.5, doses.per.day=2, tsteps=2))# Starting with an initial concentration:out <- solve_pbtk( chem.name='bisphenola', dose=0, days=2.5, output.units="mg/L", initial.values=c(Agut=200))# Working with parameters (rather than having solve_pbtk retrieve them):params <- parameterize_pbtk(chem.cas="80-05-7")head(solve_pbtk(parameters=params, days=2.5)) # We can change the parameters given to us by parameterize_pbtk:params <- parameterize_pbtk(dtxsid="DTXSID4020406", species = "rat")params["Funbound.plasma"] <- 0.1out <- solve_pbtk(parameters=params, days=2.5)# A fifty day simulation:out <- solve_pbtk( chem.name = "Bisphenol A", days = 50, daily.dose=1, doses.per.day = 3)plot.data <- as.data.frame(out)css <- calc_analytic_css(chem.name = "Bisphenol A")library("ggplot2")c.vs.t <- ggplot(plot.data, aes(time, Cplasma)) + geom_line() + geom_hline(yintercept = css) + ylab("Plasma Concentration (uM)") + xlab("Day") + theme( axis.text = element_text(size = 16), axis.title = element_text(size = 16), plot.title = element_text(size = 17)) + ggtitle("Bisphenol A")print(c.vs.t)# The following will not work because Diquat dibromide monohydrate's # Henry's Law Constant (-3.912) is higher than that of Acetone (~-4.5):try(head(solve_pbtk(chem.cas = "6385-62-2")))# However, we can turn off checking for phys-chem properties, since we know# that Diquat dibromide monohydrate is not too volatile:head(solve_pbtk(chem.cas = "6385-62-2", physchem.exclude = FALSE))# Caco-2 absorption tests:p <- parameterize_pbtk(chem.name="Aminopterin")# calculate what initial dose of 1 mg/kg should be in uM in the gut:initial.dose <- signif(1/1e3*1e6/p[["MW"]]*p[["BW"]]*p[["Fabsgut"]], 4)# This should be the same as what solve_pbtk givesus:initial.dose == solve_pbtk(chem.cas="80-05-7",days=1)[1,"Agutlumen"]# By default we now include calculation of Fabs and Fgut (we explicitly model# first-pass hepatic metabolism in the model "pbtk")head(solve_pbtk(chem.cas="80-05-7",days=1))# Therefore if we set Fabs = Fgut = 1 with keetit100=TRUE, we should get a# higher tissue concentrations:head(solve_pbtk(chem.cas="80-05-7",days=1, Caco2.options=list(keepit100=TRUE)))# Different ways to call the function:head(solve_pbtk(chem.cas="80-05-7",days=1))head(solve_pbtk(parameters=parameterize_pbtk(chem.cas="80-05-7"),days=1))Solve thepbtk_lifestage model, which has time-dependent parameters
Description
This function solves for the amounts or concentrations in uM of a chemicalin different tissues as functions of time based on the dose and dosingfrequency. In this PBTK formulation.C_{tissue} is the concentration in tissue at time t. Since the perfusion limited partition coefficients describe instantaneous equilibrium between the tissue and the free fraction in plasma, the whole plasma concentration isC_{tissue,plasma} = \frac{1}{f_{up}*K_{tissue2fup}}*C_{tissue}. Note that we use a single, constant value off_{up} across all tissues. Correspondingly the free plasma concentration is modeled asC_{tissue,free plasma} = \frac{1}{K_{tissue2fup}}*C_tissue. The amount of blood flowing from tissue x isQ_{tissue} (L/h) at a concentrationC_{x,blood} = \frac{R_{b2p}}{f_{up}*K_{tissue2fup}}*C_{tissue}, where we use a singleR_{b2p} value throughout the body.Metabolic clearance is modeled as being from the total plasma concentration here, though it is restricted to the free fraction incalc_hep_clearance by default. Renal clearance via glomerular filtration is from the free plasma concentration.The compartments used in this model are the gutlumen, gut, liver, kidneys,veins, arteries, lungs, and the rest of the body.The extra compartments include the amounts or concentrations metabolized bythe liver and excreted by the kidneys through the tubules.AUC is the area under the curve of the plasma concentration.
Usage
solve_pbtk_lifestage( chem.name = NULL, chem.cas = NULL, dtxsid = NULL, times = NULL, parameters = NULL, days = 10, tsteps = 4, daily.dose = NULL, dose = NULL, doses.per.day = NULL, initial.values = NULL, plots = FALSE, suppress.messages = FALSE, species = "Human", iv.dose = FALSE, input.units = "mg/kg", output.units = NULL, default.to.human = FALSE, class.exclude = TRUE, recalc.blood2plasma = FALSE, recalc.clearance = FALSE, dosing.matrix = NULL, adjusted.Funbound.plasma = TRUE, regression = TRUE, restrictive.clearance = TRUE, minimum.Funbound.plasma = 1e-04, Caco2.options = list(), monitor.vars = NULL, time.varying.params = TRUE, start.age = 360, ref.pop.dt = NULL, httkpop.generate.arg.list = list(method = "virtual individuals", nsamp = 25000), ref.params = NULL, ...)Arguments
chem.name | Either the chemical name, CAS number, or the parametersmust be specified. |
chem.cas | Either the chemical name, CAS number, or the parameters mustbe specified. |
dtxsid | EPA's DSSTox Structure ID (https://comptox.epa.gov/dashboard)the chemical must be identified by either CAS, name, or DTXSIDs |
times | Optional time sequence for specified number of days. Dosingsequence begins at the beginning of times. |
parameters | Chemical parameters from parameterize_pbtk function,overrides chem.name and chem.cas. |
days | Length of the simulation. |
tsteps | The number of time steps per hour. |
daily.dose | Total daily dose, defaults to mg/kg BW. |
dose | Amount of a single, initial oral dose in mg/kg BW. |
doses.per.day | Number of doses per day. |
initial.values | Vector containing the initial concentrations oramounts of the chemical in specified tissues with units corresponding tooutput.units. Defaults are zero. |
plots | Plots all outputs if true. |
suppress.messages | Whether or not the output message is suppressed. |
species | Species desired (either "Rat", "Rabbit", "Dog", "Mouse", ordefault "Human"). |
iv.dose | Simulates a single i.v. dose if true. |
input.units | Input units of interest assigned to dosing, defaults tomg/kg BW |
output.units | A named vector of output units expected for the modelresults. Default, NULL, returns model results in units specified in the'modelinfo' file. See table below for details. |
default.to.human | Substitutes missing animal values with human valuesif true (hepatic intrinsic clearance or fraction of unbound plasma). |
class.exclude | Exclude chemical classes identified as outside of domain of applicability by relevant modelinfo_[MODEL] file (default TRUE). |
recalc.blood2plasma | Recalculates the ratio of the amount of chemicalin the blood to plasma using the input parameters, calculated withhematocrit, Funbound.plasma, and Krbc2pu. |
recalc.clearance | Recalculates the the hepatic clearance(Clmetabolism) with new million.cells.per.gliver parameter. |
dosing.matrix | Vector of dosing times or a matrix consisting of twocolumns or rows named "dose" and "time" containing the time and amount, inmg/kg BW, of each dose. |
adjusted.Funbound.plasma | Uses adjusted Funbound.plasma when set toTRUE along with partition coefficients calculated with this value. |
regression | Whether or not to use the regressions in calculatingpartition coefficients. |
restrictive.clearance | Protein binding not taken into account (set to1) in liver clearance if FALSE. |
minimum.Funbound.plasma | Monte Carlo draws less than this value are set equal to this value (default is 0.0001 – half the lowest measured Fup in ourdataset). |
Caco2.options | A list of options to use when working with Caco2 apical tobasolateral data |
monitor.vars | Which variables are returned as a function of time. The default value of NULL provides "Cgut", "Cliver", "Cven", "Clung", "Cart", "Crest", "Ckidney", "Cplasma", "Atubules", "Ametabolized", and "AUC" |
time.varying.params | Whether or not to allow parameters to vary in time according to the nonparametric regression determined by |
start.age | The age of the individual in months at the beginning of thesimulation. Default 360. |
ref.pop.dt | The output of |
httkpop.generate.arg.list | If |
ref.params | Model parameters of a reference population used in determiningtimeseries. Recommended column binding ages in months (as |
... | Additional arguments passed to the integrator (deSolve). |
Details
Note that the model parameters have units of hours while the model output isin days.
Default NULL value for doses.per.day solves for a single dose.
Model Figure
When species is specified as rabbit, dog, or mouse, the function uses theappropriate physiological data(volumes and flows) but substitutes humanfraction unbound, partition coefficients, and intrinsic hepatic clearance.
Value
A matrix of class deSolve with a column for time(in days), eachcompartment, the area under the curve, and plasma concentration and a rowfor each time point.
Author(s)
Colin Thomson
See Also
Examples
params <- parameterize_pbtk(chem.name = 'Bisphenol A')pop.phys <- httkpop_generate(method = 'virtual individuals', nsamp = 25000, agelim_years = c(18, 79), weight_category = c("Normal"))pop.params <- create_mc_samples(chem.name = 'Bisphenol A', model = 'pbtk', httkpop.dt = pop.phys)ref.params <- cbind(pop.params, age_months = pop.phys$age_months)out <- solve_pbtk_lifestage(chem.name = 'Bisphenol A', parameters = params, days = 365, start.age = 600, # age fifty ref.params = ref.params, doses.per.day = 3, daily.dose = 1)Predict spleen mass for children
Description
For individuals under 18, predict the spleen mass from height, weight, andgender, using equations from Ogiu et al. (1997)
Usage
spleen_mass_children(height, weight, gender)Arguments
height | Vector of heights in cm. |
weight | Vector of weights in kg. |
gender | Vector of genders (either 'Male' or 'Female'). |
Value
A vector of spleen masses in kg.
Author(s)
Caroline Ring
References
Ogiu, Nobuko, et al. "A statistical analysis of the internal organ weights of normal Japanese people." Health physics 72.3 (1997): 368-383.
Price, Paul S., et al. "Modeling interindividual variation in physiological factors used in PBPK models of humans." Critical reviews in toxicology 33.5 (2003): 469-503.
Ring CL, Pearce RG, Setzer RW, Wetmore BA, Wambaugh JF (2017).“Identifying populations sensitive to environmental chemicals by simulating toxicokinetic variability.”Environment International,106, 105–118.doi:10.1016/j.envint.2017.06.004.
Tissue composition and species-specific physiology parameters
Description
This data set contains values from Schmitt (2008) and Ruark et al. (2014)describing the composition of specific tissues and from Birnbaum et al.(1994) describing volumes of and blood flows to those tissues, allowingparameterization of toxicokinetic models for human, mouse, rat, dog, orrabbit. Tissue volumes were calculated by converting the fractional mass ofeach tissue with its density (both from ICRP), lumping the remaining tissuesinto the rest-of-body, excluding the mass of the gastrointestinal contents.
Usage
tissue.dataFormat
A data.frame containing 406 rows and 5 columns.
| Column | Description |
| Tissue | The tissue being described |
| Species | The species being described |
| Reference | The reference for the value reported |
| variable | The aspect of the tissue being characterized |
| value | The value for the variable for the given tissue and species |
Details
Many of the parameters were compiled initially in Table 2 of Schmitt (2009).The full list of tissue variables described is:
| Variable | Description | Units |
| Fcell | Cellular fraction of total tissue volume | fraction |
| Fint | Interstitial fraction of total tissue volume | fraction |
| FWc | Fraction of cell volume that is water | fraction |
| FLc | Fraction of cell volume that is lipid | fraction |
| FPc | Fraction of cell volume that is protein | fraction |
| Fn_Lc | Fraction of cellular lipid tht is neutral lipid | fraction |
| Fn_PLc | Fraction of cellular lipid tht is neutral phospholipid | fraction |
| Fa_PLc | Fraction of cellular lipid tht is acidic phospholipid | fraction |
| pH | Negative logarithm of H+ ion concentration | unitless |
| Density | Tissue density | g/cm^3 |
| Vol | Tissue volume | L/kg |
| Flow | Blood flow to tissue | mL/min/kg^(3/4) |
New tissues can be added to this table to generatetheir partition coefficients.
Author(s)
John Wambaugh, Robert Pearce, and Nisha Sipes
References
Birnbaum L, Brown R, Bischoff K, Foran J, Blancato J, Clewell H, Dedrick R (1994).“Physiological parameter values for PBPK models.”International Life Sciences Institute, Risk Science Institute, Washington, DC.
Ruark CD, Hack CE, Robinson PJ, Mahle DA, Gearhart JM (2014).“Predicting passive and active tissue: plasma partition coefficients: interindividual and interspecies variability.”Journal of pharmaceutical sciences,103(7), 2189–2198.doi:10.1002/jps.24011.
Schmitt W (2008).“General approach for the calculation of tissue to plasma partition coefficients.”Toxicology in vitro,22(2), 457–467.doi:10.1016/j.tiv.2007.09.010.
Snyder WS (1974).“Report of the task group on reference man.”ICRP publication.
Wambaugh JF, Wetmore BA, Pearce R, Strope C, Goldsmith R, Sluka JP, Sedykh A, Tropsha A, Bosgra S, Shah I, others (2015).“Toxicokinetic triage for environmental chemicals.”Toxicological Sciences,147(1), 55–67.doi:10.1093/toxsci/kfv118.
See Also
Examples
# We can add thyroid to the tissue data by making a row containing# its data, subtracting the volumes and flows from the rest-of-body, # and binding the row to tissue.data. Here we assume it contains the same # partition coefficient data as the spleen and a tenth of the volume and # blood flow:new.tissue <- subset(tissue.data,Tissue == "spleen")new.tissue[, "Tissue"] <- "thyroid"new.tissue[new.tissue$variable %in% c("Vol (L/kg)","Flow (mL/min/kg^(3/4))"),"value"] <- new.tissue[new.tissue$variable%in% c("Vol (L/kg)","Flow (mL/min/kg^(3/4))"),"value"] / 10tissue.data[tissue.data$Tissue == "rest", "value"] <-tissue.data[tissue.data$Tissue == "rest", "value"] -new.tissue[new.tissue$variable %in% c("Vol (L/kg)","Flow (mL/min/kg^(3/4))"),"value"]tissue.data <- rbind(tissue.data, new.tissue)# We can add a new species (for example, wolverines) by adding new information# to the physiology.data and tissue.data tables. It can be convenient to start by# by replicating the data from another species and adjusting as appropriate:# Copy physiology data from rabbit:new.species <- physiology.data[,"Rabbit"]names(new.species) <- physiology.data[,"Parameter"]rabbit.BW <- new.species["Average BW"] # Rausch and Pearson (1972) https://doi.org/10.2307/3799057 :new.species["Average BW"] <- 31.2 # Thiel et al. (2019) https://doi.org/10.1186/s12983-019-0319-8 :new.species["Average Body Temperature"] <- 38.5 # Add new physiology data column to physiology.data table"physiology.data <- cbind(physiology.data, new.species)colnames(physiology.data)[length(colnames(physiology.data))] <- "Wolverine"# Copy tissue data from rabbit:new.tissue.data <- subset(tissue.data,Species=="Rabbit")new.tissue.data$Species <- "Wolverine"# Add new tissue data rows to tissue.data table:tissue.data <- rbind(tissue.data, new.tissue.data)# Species is now available for calculations:calc_mc_css(chem.cas="80-05-7", species="wolverine", parameterize.args.list =list(default.to.human=TRUE), suppress.messages=TRUE, samples = 100)Given a data.table describing a virtual population by the NHANES quantities, generates HTTK physiological parameters for each individual.
Description
Given a data.table describing a virtual population by the NHANES quantities, generates HTTK physiological parameters for each individual.
Usage
tissue_masses_flows(tmf_dt, add_variability = TRUE)Arguments
tmf_dt | A data.table generated by |
add_variability | An option to add variability to calculated masses andflows. Default is TRUE; use FALSE for repeatable calculations. |
Value
The same data.table, with aditional variables describing tissue massesand flows.
Author(s)
Caroline Ring
References
Barter, Zoe E., et al. "Scaling factors for the extrapolation of in vivo metabolic drug clearance from in vitro data: reaching a consensus on values of human micro-somal protein and hepatocellularity per gram of liver." Current Drug Metabolism 8.1 (2007): 33-45.
Birnbaum, L., et al. "Physiological parameter values for PBPK models." International Life Sciences Institute, Risk Science Institute, Washington, DC (1994).
Geigy Pharmaceuticals, "Scientific Tables", 7th Edition, John Wiley and Sons (1970)
McNally, Kevin, et al. "PopGen: a virtual human population generator." Toxicology 315 (2014): 70-85.
Ring CL, Pearce RG, Setzer RW, Wetmore BA, Wambaugh JF (2017).“Identifying populations sensitive to environmental chemicals by simulating toxicokinetic variability.”Environment International,106, 105–118.doi:10.1016/j.envint.2017.06.004.
Allometric scaling.
Description
Allometrically scale a tissue mass or flow based on height^(3/4).
Usage
tissue_scale(height_ref, height_indiv, tissue_mean_ref)Arguments
height_ref | Reference height in cm. |
height_indiv | Individual height in cm. |
tissue_mean_ref | Reference tissue mass or flow. |
Value
Allometrically scaled tissue mass or flow, in the same units astissue_mean_ref.
Author(s)
Caroline Ring
References
Ring CL, Pearce RG, Setzer RW, Wetmore BA, Wambaugh JF (2017).“Identifying populations sensitive to environmental chemicals by simulating toxicokinetic variability.”Environment International,106, 105–118.doi:10.1016/j.envint.2017.06.004.
Microtiter Plate Well Descriptions for Armitage et al. (2014) Model
Description
Microtiter Plate Well Descriptions for Armitage et al. (2014) model fromHonda et al. (2019)
Usage
well_paramFormat
A data frame / data table with 11 rows and 8 variables:
- sysID
Identifier for each multi-well plate system
- well_desc
Well description
- well_number
Number of wells on plate
- area_bottom
Area of well bottom in mm^2
- cell_yield
Number of cells
- diam
Diameter of well in mm
- v_total
Total volume of well in uL)
- v_working
Working volume of well in uL
Author(s)
Greg Honda
References
Armitage JM, Wania F, Arnot JA (2014).“Application of mass balance models and the chemical activity concept to facilitate the use of in vitro toxicity data for risk assessment.”Environmental science & technology,48(16), 9770–9779.doi:10.1021/es501955g.
Honda GS, Pearce RG, Pham LL, Setzer RW, Wetmore BA, Sipes NS, Gilbert J, Franz B, Thomas RS, Wambaugh JF (2019).“Using the concordance of in vitro and in vivo data to evaluate extrapolation assumptions.”PloS one,14(5), e0217564.doi:10.1371/journal.pone.0217564.
WHO weight-for-length charts
Description
Charts giving weight-for-length percentiles for boys and girls under age 2.
Usage
wflFormat
a data.table with 262 rows and 4 variables:
- Sex
"Male" or "Female"
- Length
Recumbent length incm
- P2.3
The 2.3rd percentile weight in kg for the corresponding sexand recumbent length
- P97.7
The 97.7th percentile weight in kg forthe corresponding sex and recumbent length
Details
For infants under age 2, weight class depends on weight for length percentile.#'
- Underweight
<2.3rd percentile
- Normalweight
2.3rd-97.7th percentile
- Obese
>=97.7th percentile
Source
https://www.who.int/tools/child-growth-standards/standards/weight-for-length-height