
Thecirclesplot library helps you displayproportions between different objects. Say earth is 3.6 times biggerthan the moon. How can you visualize that? It would be helpful if youcould draw earth and moon with their exact diameter to make your readersaware of the difference in size. This is where the lib comes into play.It plots two circles with the given diameter next to each other, soreaders can observe the ratio. Although it is extremely helpful tovisualize planets, it can also be used for other things too.
Install the latest version fromCRAN:
install.packages("circlesplot")or the development version fromGitHub:
install.packages("devtools")devtools::install_github("BenSt099/circlesplot")You can start by plotting the solar system and its planets:
library('circlesplot')library('viridis')planets=c('Mercury','Venus','Earth','Mars','Jupiter','Saturn','Uranus','Neptune')diameter=c(4879.4,12103.6,12756.3,6792.4,142984,120536,51118,49528)circlesplot(cp_vals=diameter,cp_text=planets,cp_max=4L,cp_title="Planets",cp_color=viridis(8),cp_sort='desc')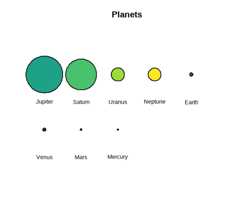

The left plot is exported aspng, while the right isexported aspdf.
You may see something unexpected inRStudio: When you createthe plot and it is displayed in the lower right window (in the plotstab), it seems like that a part of the plot is cut off or it’s displayedvery small. This only happens due to the size of the lower right window.Either resize it or use the following r code to save the plot aspdf:
pdf("path/to/your/pdf/plot1.pdf")circlesplot(cp_vals=diameter,cp_text=planets,cp_max=4L,cp_color=viridis(8),cp_title="Planets",cp_sort='desc')dev.off()If you need help, take a deeper look into themanualor open an issuehere.
This project is licensed under MIT License.