Tivy is an R package specialized in processing andanalyzing fisheries data from Peru’s anchovy (Engraulis ringens)fishery. It facilitates the handling of information from fishing triplogbooks, size records, hauls, and official announcements issued forpreventive closures.
📋 Main Features
- 🐟Data Processing: Automated processing of fishinghauls, trips, and length frequency data
- 🗺️Spatial Analysis: Coordinate conversion,distance calculations, and fishing zone analysis
- 📊Juvenile Analysis: Fish population structureanalysis with length-weight relationships
- 📈Visualization: Static (ggplot2) and interactive(leaflet) mapping capabilities
- 📋Regulatory Integration: Processing of officialfishing closure announcements
📦 Installation
You can install the development version ofTivy fromGitHub:
# install.packages("devtools")devtools::install_github("HansTtito/Tivy")Install CRAN release:
install.packages("Tivy")🚀 Usage Examples
Basic Loading and Processing
library(Tivy)# Load and process logbook filesdata_hauls<-process_hauls(data_hauls = calas_bitacora,correct_coordinates =TRUE,verbose =TRUE)data_fishing_trips<-process_fishing_trips(data_fishing_trips = faenas_bitacora,verbose =TRUE)hauls_length<-process_length(data_length = tallas_bitacora,verbose =TRUE)Data Integration
# Combination of length and fishing trip datadata_length_fishing_trips<-merge(x = data_fishing_trips,y = hauls_length,by ='fishing_trip_code',all =TRUE)# Complete integration with haul datadata_total<-merge_length_fishing_trips_hauls(data_hauls = data_hauls,data_length_fishing_trips = data_length_fishing_trips)# Add derived variables (juveniles, distance to coast, etc.)final_data<-add_variables(data = data_total,JuvLim =12,# Juvenile threshold in cmdistance_type ="haversine",unit ="nm")Juvenile Analysis
# Define length columns manuallylength_cols<-as.character(seq(from =8,to =15,by =0.5))# Length-weight relationship parameters (for anchoveta)a<-0.0001b<-2.983# Create catch column in tonsfinal_data$catch_t<- final_data$catch_ANCHOVETA/1000# Weight length frequencies according to catchfinal_data_weighted<-apply_catch_weighting(data = final_data,length_cols = length_cols,catch_col ='catch_t',a = a,# Length-weight coefficientb = b# Length-weight exponent)# Calculate juvenile proportion by groupjuvenile_results<-summarize_juveniles_by_group(data = final_data_weighted,group_cols =c("dc_cat"),# Distance categorylength_cols =paste0("weighted_", length_cols),juvenile_limit =12,a = a,b = b)print(juvenile_results)Visualization of Results
# Create date column for plottingfinal_data_weighted$unique_date<-convert_to_date(final_data_weighted$start_date_haul)# Basic plot of juveniles by datejuvenile_plot<-plot_juvenile_analysis(data = final_data_weighted,x_var ="unique_date",fill_var ="dc_cat",length_cols =paste0("weighted_", length_cols),a = a,b = b,reference_line =10)print(juvenile_plot)
# Complete dashboard of juvenile analysisdashboard<-create_fishery_dashboard(data = final_data_weighted,date_col ="unique_date",length_cols =paste0("weighted_", length_cols),a = a,b = b,latitude_col ="lat_initial",longitude_col ="lon_initial",catch_col ="catch_t",juvenile_col ="juv",date_breaks ="1 day")# View individual dashboard componentsdashboard$comparison# Juvenile comparisondashboard$trends# Juvenile trends over timedashboard$catch_trends# Cumulative catchdashboard$spatial_map# Spatial distribution mapdashboard$dashboard# Complete panel with all plots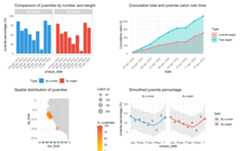
Analysis of OfficialAnnouncements
# Fetch announcements from PRODUCE websitepdf_announcements<-fetch_fishing_announcements(start_date ="01/03/2025",end_date ="31/03/2025",download =FALSE# Set TRUE to download PDF files)print(pdf_announcements)# Extract information from PDF announcementsresults<-extract_pdf_data(pdf_sources = pdf_announcements$DownloadURL)# Format data for visualizationformatted_results<-format_extracted_data(data = results,convert_coordinates =TRUE)# Visualize closed areas with ggplot (static)static_plot<-plot_fishing_zones(data = formatted_results,type ="static",show_legend =TRUE,title ="Fishing Closure Areas")print(static_plot)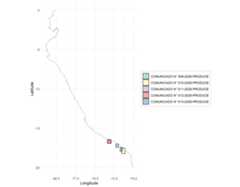
# Interactive visualization with leafletinteractive_map<-plot_fishing_zones(data = formatted_results,type ="interactive",show_legend =TRUE,base_layers =TRUE,minimap =TRUE)interactive_map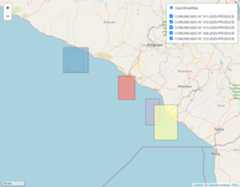
📊 Recommended Workflow
- Load and process haul, fishing trip, and lengthdata using
process_*()functions - Integrate datasets using
merge_length_fishing_trips_hauls() - Add derived variables with
add_variables()(distances, juveniles, etc.) - Prepare catch data by converting to appropriateunits (tons)
- Apply catch weighting using
apply_catch_weighting()for biomass analysis - Analyze juvenile proportions by zones or seasonswith
summarize_juveniles_by_group() - Create date columns for temporal analysis using
convert_to_date() - Visualize results through
plot_juvenile_analysis()orcreate_fishery_dashboard() - Integrate regulatory data using announcementprocessing functions
📄 Supported Data Structure
Tivy is designed to work with fishery data from Peru.The package includes built-in sample datasets:
calas_bitacora: Sample haul recordswith coordinates and catch datafaenas_bitacora: Sample fishing tripinformationtallas_bitacora: Sample lengthfrequency data- Official announcements: PDF documents with closureinformation from PRODUCE
🔧 Main Functions
| Category | Functions | Description |
|---|---|---|
| Data Processing | process_hauls(),process_fishing_trips(),process_length() | Data loading, cleaning, and standardization |
| Data Integration | merge_length_fishing_trips_hauls(),add_variables() | Data combination and variable enrichment |
| Spatial Analysis | dms_to_decimal(),coast_distance(),land_points() | Coordinate conversion and spatial calculations |
| Juvenile Analysis | apply_catch_weighting(),summarize_juveniles_by_group(),calculate_fish_weight() | Population structure and juvenile proportion analysis |
| Visualization | plot_juvenile_analysis(),plot_fishing_zones(),create_fishery_dashboard() | Static and interactive plotting |
| Announcements | fetch_fishing_announcements(),extract_pdf_data(),format_extracted_data() | Processing of official regulatory announcements |
| Utilities | convert_to_date(),find_columns_by_pattern(),validate_*_data() | Helper functions and data validation |
📚 Documentation
Comprehensive documentation is available through vignettes:
# Overview and quick startvignette("introduction",package ="Tivy")# Detailed data processing workflowsvignette("data-processing",package ="Tivy")# Spatial analysis and mappingvignette("spatial-analysis",package ="Tivy")# Fish population analysisvignette("fish-analysis",package ="Tivy")Built-in Datasets
peru_coastline: Peruvian coastline coordinates forspatial analysisperu_coast_parallels: Parallel lines at differentnautical mile distancescalas_bitacora: Sample haul datafaenas_bitacora: Sample trip datatallas_bitacora: Sample length data
Requirements
- R >= 4.0.0
- Required packages: dplyr, tidyr, lubridate, stringr, ggplot2,leaflet, RColorBrewer
- Suggested packages: future, patchwork, rnaturalearth (for enhancedfunctionality)
👩💻 Contributions
Contributions are welcome! Please consider:
- Opening an issue to discuss important changes
- Following the project’s code style
- Including tests for new features
- Updating the corresponding documentation
📚 Citation
If you useTivy in your research, please cite it as:
Ttito, H. (2025). Tivy: Tools for Fisheries Data Analysis in Peru. R package version 0.1.1. https://github.com/HansTtito/TivyLicense
This project is licensed under the MIT License - see theLICENSE file for details.
Support
- 📖Documentation: See package vignettes andfunction help pages
- 🐛Bug reports:GitHub Issues
- 📧Contact: kvttitos@gmail.com
Acknowledgments
- The R community for excellent packages that make this workpossible
- Fisheries researchers and managers who provided feedback andrequirements
[8]ページ先頭
©2009-2025 Movatter.jp